Download
1 / 18
180 likes | 186 Views
This presentation discusses the changes in food prices, the U.S. food marketing system, and the factors leading to higher commodity prices. It also provides information on countries pursuing biofuels and events in 2007 that affected commodity prices.

E N D
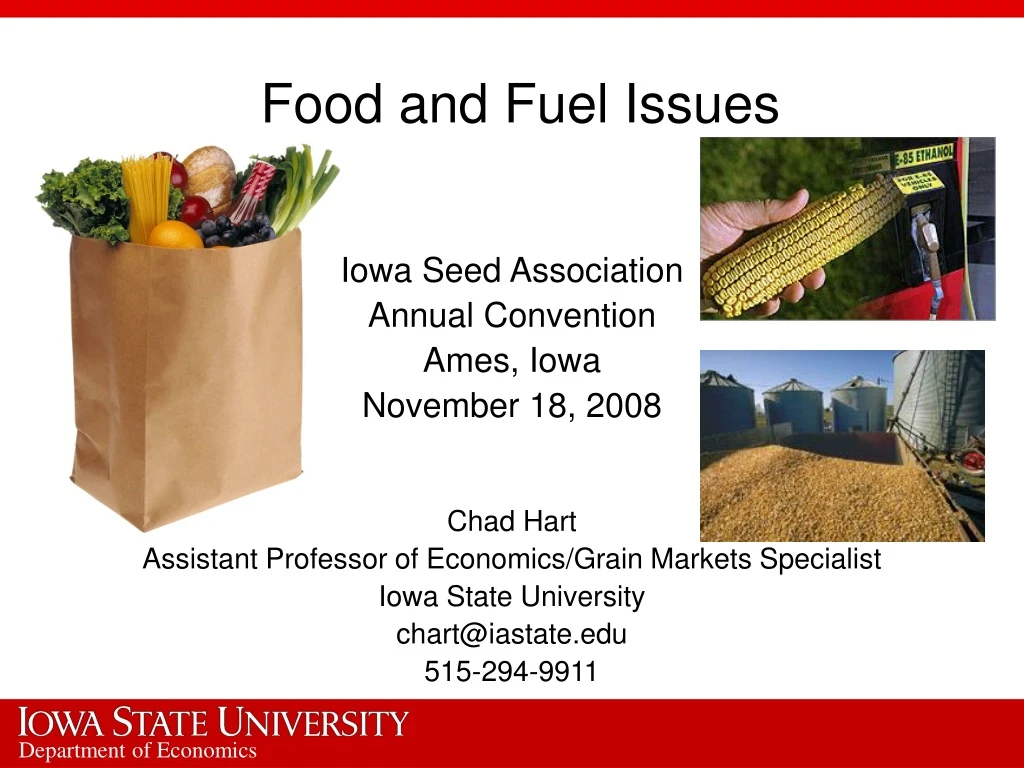
Food and Fuel Issues Iowa Seed Association Annual Convention Ames, Iowa November 18, 2008 Chad Hart Assistant Professor of Economics/Grain Markets Specialist Iowa State University chart@iastate.edu 515-294-9911
Change in Food Price Indexes, 2005-2007 Item Final Final Final 2005 2006 2007 Consumer price indexes Percent change All food 2.4 2.4 4.0 Food away from home 3.1 3.1 3.6 Food at home 1.9 1.7 4.2 Meats, poultry, and fish 2.4 0.8 3.8 Eggs -13.7 4.9 29.2 Dairy products 1.2 -0.6 7.4 Fats and oils -0.1 0.2 2.9 Fruits and vegetables 3.7 4.8 3.8 Sugar and sweets 1.2 3.8 3.1 Cereals and bakery products 1.5 1.8 4.4 Nonalcoholic beverages 2.9 2.0 4.1 Other foods 1.6 1.4 1.8 Sources: Bureau of Labor Stats., USDA-ERS
Corn Prices Source: CBOT
U.S. Ethanol Production Source: Renewable Fuels Association
U.S. Food Marketing System • Five distinct sectors • Agricultural production • 2 million farms • Food processing and manufacturing • 25,000 food and beverage companies • Wholesale distribution • 33,000 food wholesalers • Retail distribution • 113,000 food retailers • 378,000 foodservice companies • Consumption • 111 million households
U.S. Food Marketing System In 2001, government estimates showed: 23.7 million employed in the food system 12% of the nation’s gross domestic product Food is a major component of our economy Each step in the system adds value and costs
The Food Dollar Source: USDA-ERS
Declining Farm Value in Food In the 1950s, 25% of food was consumed away from home. Today, nearly 50% of food is consumed away from home. Source: USDA-ERS
Farm to Retail Food Price Spread Source: USDA-ERS, 2001
Factors Leading to Higher Commodity Prices Source: USDA-ERS, Trostle, July 2008
Commodity Price Indexes Source: International Financial Statistics
Population Source: U.S. Bureau of the Census
Countries Pursuing Biofuels • US • Brazil • Argentina • Colombia • Paraguay • Canada • Uruguay • Mexico • Thailand • New Zealand • South Africa • South Korea • Philippines • Indonesia • Pakistan • China • India • Malaysia • Australia • Japan • EU • Russia • Not a complete list
Events in 2007 • Droughts: • Northern Europe, Ukraine, Russia, Northwest Africa, Turkey, Australia, and Argentina • Increased export taxes: • China, Argentina, Russia, Kazakhstan, Malaysia, and Indonesia • Export restrictions: • Argentina, Ukraine, India, Vietnam, Serbia, Egypt, Cambodia, Indonesia, and Kazakhstan
Change in Food Price Indexes, 2005-2009 Item Final Final Final Forecast Forecast 2005 2006 2007 2008 2009 Consumer price indexes Percent change All food 2.4 2.4 4.0 5.0 to 6.0 4.0 to 5.0 Food away from home 3.1 3.1 3.6 4.0 to 5.0 4.0 to 5.0 Food at home 1.9 1.7 4.2 5.5 to 6.5 4.0 to 5.0 Meats, poultry, and fish 2.4 0.8 3.8 3.0 to 4.0 5.0 to 6.0 Eggs -13.7 4.9 29.2 13.5 to 14.5 1.0 to 2.0 Dairy products 1.2 -0.6 7.4 8.0 to 9.0 4.0 to 5.0 Fats and oils -0.1 0.2 2.9 13.0 to 14.0 3.0 to 4.0 Fruits and vegetables 3.7 4.8 3.8 6.5 to 7.5 3.5 to 4.5 Sugar and sweets 1.2 3.8 3.1 4.5 to 5.5 3.0 to 4.0 Cereals and bakery products 1.5 1.8 4.4 9.0 to 10.0 3.5 to 4.5 Nonalcoholic beverages 2.9 2.0 4.1 3.5 to 4.5 3.0 to 4.0 Other foods 1.6 1.4 1.8 4.0 to 5.0 3.0 to 4.0 Updated October 20, 2008 Sources: Bureau of Labor Stats., USDA-ERS
Quick Notes • Farm value is less than 20% of the food dollar. • Costs beyond the farm gate make up more than 80% of the food dollar. • Labor, transportation, energy, advertising, etc. • There have been a number of factors influencing food and commodity prices. • USDA Chief Economist Joe Glauber recently stated that biofuels are responsible for 10% of the inflation in food values.
Thank you for your time!Any questions?http://www.econ.iastate.edu/faculty/hart/