Download
1 / 32
320 likes | 474 Views
Overview. FOOD AND FUEL Global Perspectives in Food and Agriculture. Vienna, 15 March 2007 Alexander Müller Assistant Director-General Food and Agriculture Organization of the United Nations. Ein kurzer Rückblick. Rückblick auf das Erreichte.

E N D
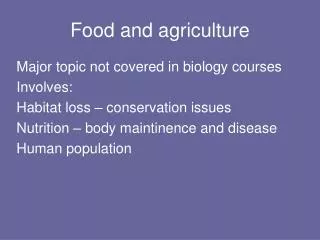
Overview FOOD AND FUELGlobal Perspectives in Food and Agriculture Vienna, 15 March 2007 Alexander Müller Assistant Director-General Food and Agriculture Organization of the United Nations
Ein kurzer Rückblick Rückblick auf das Erreichte Die Errungenschaften der modernen Landwirtschaft waren immens Quelle: FAOSTAT
Rückblick auf das Erreichte 1,400 250 1,200 200 1,000 US/t (konstante Wechselkurse von 1990) Palmöl ($/ton) Sojabohnen ($/ton) 150 800 Mais ($/ton) Index, 1990=100 Reis ($/ton) Weizen ($/ton) 600 100 400 50 200 0 0 1960 1965 1970 1975 1980 1985 1990 1995 2000 • Ein kurzer Rückblick ... bei einem drastischen Verfall der Weltmarktpreise Landwirtschaft (Index) Nahrung (Index) Quelle: Weltbank, “Pink Sheets”
Assumptions World population: 1750 – 2050 Further growth, but at drastically declining rates 12.0 0.9 0.8 0.7 9.0 0.6 0.5 Annual increments (billions) 6.0 Total population (billions) 0.4 0.3 3.0 0.2 0.1 0.0 0 1750 1800 1850 1900 1950 2000 2050 Source: UN, 2003
Assumptions Population growth is concentrated in developing countries
Urban and Rural Population – 1950-2030 Assumptions Source: UN, World Population Assessment 2002
Assumptions 1. The main determinants GDP growth – per capita - by region 1986-1998* 1998*-2015 2015-2030 7.0 6.0 5.0 4.0 Percent p.a. 3.0 2.0 1.0 0.0 -1.0 World EU-15 Developing Industrial South Asia L-America East Asia s.S. Africa NENA E. Europe Ex-USSR -2.0 Source: World Bank, GEP 2003
Assumptions Distribution of income: today and in 2030 US$ 13,416 per person US$ 986 per person Increase by more than 300% Increase by more than 200% US$ 3,408 per person US$ 33,361 per person
Food and nutrition Improvements in sight, but hardly enough to meet the target of the WFS 1200 1000 800 Unterernährte in Millionen 600 400 200 0 1969/71 1990/92 1999/01 2015 2030 Ostasien Südasien s.S-Afrika Latein Amerika Naher Osten-Nordafrika Entwicklungsländer WFS-Ziel MDG Quelle: FAO 2003
Food and nutrition Success and failure in fighting hunger Source: FAO, SOFI, 2002
Die Exportmärkte Developing countries will remain big grain importers
Die Exportmärkte Der Nahe Osten und Nordafrika werden auch künftig die größten Exportchancen bieten
The resource base Land in use versus suitable area for crop production 1200 1066 1031 1000 874 Suitable for rainfed crop production 800 Arable land use, 1997/99 million ha 600 497 366 400 387 220 265 200 232 228 99 207 203 86 0 Latin America sub-Saharan East Asia South Asia Near Industrialized Transition and Africa East/North countries Economies Caribbean Africa
4. What challenges for the resource base? The resource base Irrigation water withdrawal as a share of renewable water resources (%) 70 Today in 2030 60 50 40 30 20 10 0 East Asia South Asia Latin America sub-Saharan Africa Near East/North Africa All developing countries
Das Potenzial Wie groß ist der Markt für Biomasse und Biotreibstoffe? 1.) Potential based on Schrattenholzer and Fischer, IIASA, 2000 2.) Based on IEA: Key energy statistics, 2006 (TPES), EIA (US) projections for 2030 are 684 EJ, 721 Q (BTU 1 British thermal unit (Btu) = 1,055.05585262 joules (J)) 3.) Derived from http://www.earth-policy.org/Updates/2005/Update49.htm, Earth Policy Institute 4.) Assuming an average yield per hectare for ethanol of 4200 l (3000 l US maize, 5500 l Brazil cane, 6900 l France sugar beet) and of 3800 l/ha for biodiesel (average). Most recent yields are about 10% higher for cane and 20% higher for maize. 5.) 850 million ha would be required to meet 2002 road transportation fuels needs (77 EJ) at current yields (l biofuel/ha), technology, and crop composition. 6.) Area for developing and developed countries, not OECD and non OECD 7.) Assuming an energy content of 34 MJ/l for biodiesel and 21.1 MJ/l for ethanol 8.) Bruinsma (ed), World agriculture: towards 2015/2030, An FAO Perspective, 2003, total suitable land for rainfed agriculture 9.) WEC/ IIASA Scenarios: 620 EJ for Scenario C1-C2, 1084 EJ for Scenario A1-A3, 23.8845 Mtoe = 1 EJ 10.) IEA (2003), “Biofuels for Transport”, table 6.8.; road transportation in 2030 about 120 EJ; total transport: 132 EJ; EIA. 11.) 15-60 EJ: most biomass fuels are not traded on world markets, estimates of consumption are highly uncertain. 12.) Based on regional estimates from Schrattenholzer and Fischer, IIASA, 2000 13) The IEA Energy Outlook 2006 assumes a 4% share in road transportation in 2030 in the reference case, 7% in the alternative scenario
Bioenergy potential per region: different scenarios, year 2050 Exajoules/yr Source: Juergens and Mueller forthcoming 2007, based on data from WWI 2006)
Bioenergy potential per type of biomass: different scenarios, year 2050 Exajoules/yr Source: Juergens and Mueller forthcoming 2007, based on data from Faaij 2006
Die Bioenergiemärkte - Preiseffekte Wettbewerbsfähigkeit und Mindestpreiseffekt Daten: Nymex and EIA, J. Schmidhuber (2007)
Zyklische Effekte überlagern von strukturellen Umbruch Märkte im Umbruch
The competitiveness Competitiveness by feedstock Parity prices: Petrol–Crude oil – Ethanol Various feedstocks and farming/production systems 120 100 80 Crude, US$/bbl 60 40 20 0 0 0.1 0.2 0.3 0.4 0.5 0.6 0.7 0.8 Petrol, US$/l Gasoline-Crude US$ Cane Brazil, top producers Cane, Brazil, average Cassava, Thaioil, 2 mio l/d Maize, US Cassava, Thailand, OTC joint venture Palmoil, MPOB project Mixed feedstock Europe BTL: Synfuel/Sunfuel Josef Schmidhuber (2005)
Die Bioenergiemärkte Wettbewerbsfähig als Heiz- und Brennstoffe? Quelle: Eigene Berechnungen auf Basis von EIA, IEA, FAO Daten. J. Schmidhuber (2005)
Die Bioenergiemärkte – Preiseffekte und Risiken Reicht der Zollschutz für Ethanol? Zölle, Preise und Produktionskosten für Ethanol 0.6 0.5 P-kosten tEU tEU tEU-40% tEU-40% tUS 0.4 tUS CIF US €/l 0.3 CIF EU FOB BRA 0.2 MP US Ct/l MP EU 0.1 0 Mais Mais Weizen Zuckerrohr Zuckerrüben EU BRA USA
The impacts on prices and markets US ethanol-some market impacts
The impacts on prices and markets Cross links: Impacts on international commodity prices Source: @2030 simulation results
Bioenergy and Land Use Scenarios (2050) : IPCC Third Assessment Report (2001)
Competition for Biomass Source: Juergens (FAO) 2006, adapted from SEI/ESMAP 2005
Different Bioenergy Sources with different land requirements Source: Faaij/FAO 2005
Land requirements for replacing 10% of petrolium based fuels in the respective region/country (based on average crop area and yield data for 2000-2004 and transport fuel consumption in 2004) Source: based on data from WWI 2006 Notes: World 1/2: area relative to land used for cereals, oilseeds and sugar globally (World 1) and in five major biofuel producing regions (World 2).
Availability of land for bioenergy plantations in the EU and the US Source: Schlamadinger et al. 2002, p.63
Land available for biomass production for energy in the EU Source: EEA Report No 7/2006
Environmentally-compatible bioenergy potential from forests in the EU Source: EEA Report No 7/2006 Notes: Calculations cover EU-25 Member States without Cyprus, Greece, Luxembourg and Malta
Determinants of Bioenergy Production Population growth and economic development Energy prices Food consumption: per capita calorie intake and composition of diet Land use patterns (feasibility of marginal/degraded lands) Efficiency of food production: crop yields, livestock production Forest productivity and sustainable harvest levels. Competing demands for land: nature reserves, endangered/protected ecosystems, recreation, amenity Competing demands for wood and agriculture based bio-materials.