Download
1 / 16
160 likes | 192 Views
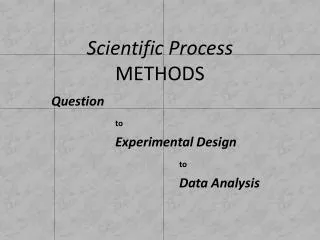
Scientific Methods. Chapter 2 Psychology 301. Basic Steps for Conducting Scientific Research. Step 1: Formulate a hypothesis. Step 4: Report the results. Step 2: Design a study. Step 3: Collect & analyze data. The Scientific Process. Theory. Hypotheses. Revise Theory.

E N D
Scientific Methods Chapter 2 Psychology 301
Basic Steps for Conducting Scientific Research Step 1: Formulate a hypothesis Step 4: Report the results Step 2: Design a study Step 3: Collect & analyze data
The Scientific Process Theory Hypotheses Revise Theory Empirical Tests Replicate Not Supported Supported Confidence in theory decreases Confidence in theory increases Discard Theory
Experimental Research Experiments Descriptive/Correlational Research Surveys Observation Naturalistic Contrived Case Studies Types of psychological research
Experiments - Do changes in one variable (X) cause changes in another variable (Y)? Independent Variable (X) condition or event that is manipulated by experimenter Dependent Variable (Y) variable that is affected (hopefully) by manipulating independent variable Extraneous Variable(s) any variable other than independent variable that may influence dependent variable Experiments
Example A study was conducted to examine the effects of temperature on aggression. Participants were randomly assigned to one of three conditions (low [70o-72o], moderate [80o-82o], or a high [90o-92o] temperature room). While in the room an assistant irritates the participants. Participants were later given a chance to “evaluate” the assistant and told that low ratings would cause the assistant to be fired.
Research Methods • Confounding of Variables • occurs when independent and extraneous variables are linked together • makes it impossible to tell which variable affected dependent variable
Research Methods • Minimize confounding with consistent procedures • Minimize confounding with random assignment • participants have an equal chance of being assigned to any group or condition in the study. • the goal of random assignment is to equally distribute potential extraneous variables in each group.
Use 1 group of participants who act as their own control group (e.g., expose each participant to each temperature) Manipulate more than 1 independent variable at a time (temperature & humidity) Measure more than 1 dependent variable at a time (aggression & helping) Variations in experimental design
Advantages of Experimental Research Allows conclusions about cause & effect relationships between variables Disadvantages of Experimental Research Experimental conditions are artificial do results “generalize” to the real world? Some questions can’t be tested in an experiment Pros and Cons
Advantages Study phenomena that can’t be studied in a lab riots effects of supervisor behavior on employees effects of job loss on couples’ relationship quality effects of smoking on physical health Very realistic results can be generalized to other settings Disadvantages less control over extraneous variables difficult to measure behavior as precisely (compared to lab experiments) cannot demonstrate cause and effect relationships Correlation/Descriptive Research
Correlation • The extent to which one variable can be understood on the basis of another • Two properties of correlation coefficient • direction (positive or negative) • magnitude (strength of the relationship)
Positive Correlation r = .95
No Correlation r = .00
Negative Correlation High r = -.95 Low Low High