Download
1 / 4
40 likes | 170 Views
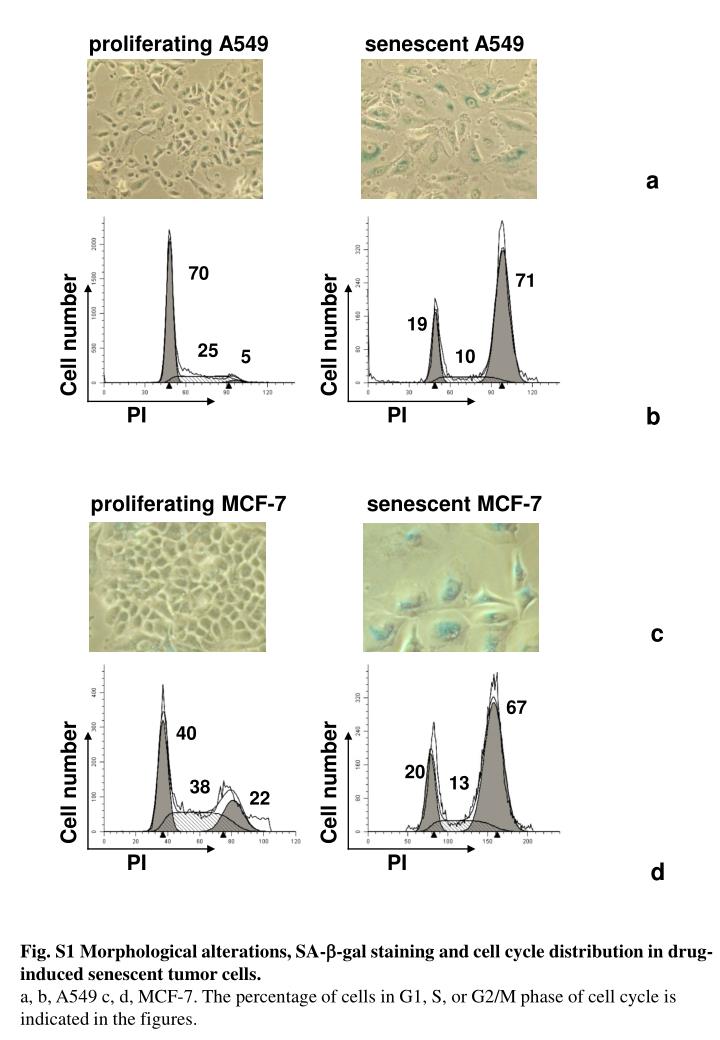
70. 71. 19. 25. 10. 5. Cell number. Cell number. Cell number. Cell number. PI. PI. PI. PI. 67. 40. 20. 13. 38. 22. proliferating A549. senescent A549. a. b. proliferating MCF-7. senescent MCF-7. c. d.

E N D
70 71 19 25 10 5 Cell number Cell number Cell number Cell number PI PI PI PI 67 40 20 13 38 22 proliferating A549 senescent A549 a b proliferating MCF-7 senescent MCF-7 c d Fig. S1Morphological alterations, SA-b-gal staining and cell cycle distribution in drug-induced senescent tumor cells. a, b, A549 c, d, MCF-7. The percentage of cells in G1, S, or G2/M phase of cell cycle is indicated in the figures.
MCF-7 (CPT) * * cntr cntr 20 ng/ml 20 ng/ml * * Cell number Cell number TMRE TMRE a A549 (CPT) b Fig. S2 APO010 triggers apoptosis in camptothecin-induced senescent cells. In order to induce senescence, A549 and MCF-7 cells were treated with 0.5 mM camptothecin for 72h. (a) left panel, proliferating and senescent MCF-7 cells were treated with indicated concentrations of APO010 for 24h. Percentage of apoptotic cells was estimated by TMRE staining. Data are mean±S.D. of three independent experiments. Statistical analysis by unpaired Student’s t-test: * p≤0.0001. Right panel, representative flow cytometric analysis of senescent MCF-7 cells stained with TMRE. Open histogram represents untreated cells, whereas filled histogram represents cells treated with APO010 for 24h. (b) left panel, proliferating and senescent A549 cells were treated with indicated concentrations of APO010 for 24h. Percentage of apoptotic cells was estimated by TMRE staining. Data are mean±S.D. of three independent experiments. Statistical analysis by unpaired Student’s t-test: * p≤0.0001. Right panel, representative flow cytometric analysis of senescent A549 cells stained with TMRE. Open histogram represents untreated cells, whereas filled histogram represents cells treated with APO010 for 24h.
* MSCR M2 ** RelA Actin ** * ASCR A2 RelA Actin a b Fig. S3 Inhibition of RelA expression by shRNA. (a) The expression of RelA in M2 and control MSCR cells was determined by Western blot analysis on total cell lysates. Filters were stripped and re-probed with anti-a-tubulin antibody. NF-kB-dependent transcriptional activity was determined by luciferase assay, in cells incubated with (+) or without (-) TNF-a (2000U/ml). Data are shown as the mean ± S.D. Statistical analysis by unpaired Student’s t-test: * p≤0.015; ** p≤0.007. (b) The expression of RelA in A2 and control ASCR cells was determined by Western blot analysis on total cell lysates. Filters were stripped and re-probed with anti-a-tubulin antibody. NF-kB-dependent transcriptional activity was determined by luciferase assay, in cells incubated with (+) or without (-)TNF-a (2000U/ml). Data are shown as the mean ± S.D. Statistical analysis by unpaired Student’s t-test: * p≤0.08; ** p≤0.007.
MCF-7 * * * * * * * ** * * CXCL-10 IL-8 RANTES IFN-g TNF-a Fig. S4 Gradual development of SASP in drug-induced senescent tumor cells. Real-time PCR analysis of CXCL-10, IL-8, RANTES, INF-g, and TNF-a in proliferating and senescent MCF-7 cells, 5 and 20 days after release from doxorubicin treatment. Data are mean±SEM of three independent experiments. Statistical analysis by unpaired Student’s t-tes t: * p≤0.05; ** p≤0.007.