Download
1 / 45
460 likes | 566 Views
Prediction and sentiment analysis. Mahsa Elyasi. PAPER 1. Word Salad: Relating Food Prices and Descriptions V Chahuneau , K Gimpel , B.R Routledge , L Scherlis , N.A Smith . Motivation. Caesar Salad Romain hearts Croutons, shaved, parmesan cheese and classic Caeser dressing $9.95.

E N D
Prediction and sentiment analysis MahsaElyasi
Word Salad:Relating Food Prices and DescriptionsV Chahuneau, K Gimpel, B.R Routledge, L Scherlis, N.A Smith
Motivation Caesar Salad Romain hearts Croutons, shaved, parmesan cheese and classic Caeser dressing $9.95 Poulet Cajun $28.00 Chicken Quesadillas Made with fresh Salsa, jack and Cheddar cheese $6.99 2 pcs chicken meal $4.99
Data • 7 U.S cities location(city, neighborhood) Services available(delivery, wifi) Ambience(good for groups, noise level) Price range( $ to $$$$)
Data • Distribution of prices & stars
Models • Linear regression • Logistic regression • Features: • METADATA : <field, value> • MENUNAMES : n-grams • MENUDESC : n-grams • MENTION : n-grams(word + ITEM + word)
Item price prediction • Predict the price of each item on a menu
Item price prediction • Baselines • Predict mean • Predict median • Regression • Evaluation • Mean absolute error • Mean relative error Item’s price = w * x
Number of features with non-zero weight Item price prediction Total number of features $ %
Item price prediction • MENUDESC-authenticity
Item price prediction • MENUDESC-size
Price range prediction • For each restaurant on Yelp page McCullagh Ordinal regression
From Tweets to Polls:Linking Text Sentiment to Public Opinion Time SeriesB O’Connor, R Balasubramanyan, B.R Routledge, N.A Smith
Text Data: Twitter • Twitter is large, public • Sources • Archiving twitter Streaming API • Scrape of earlier messages via API • Sizes • 0.7 billion messages, Jan 2008 – Oct 2009 • 1.5 billion messages, Jan 2008 _May 2010 user population are changing Message Language Identify user location The Republican’s are less likely to used social media for political purposes age Misleading information
Poll Data • Consumer confidence • Index of Consumer Sentiment (ICS) • Gallup Daily • 2008 Presidential Elections • Pollster.com • 2009 Presidential Job Approval • Gallup Daily
Text Analysis location lying • Message retrieval • Identify messages relating to the topic • consumer confidence: job, jobs, economy • Presidential approval: obama • Election: obama, mccain • Opinion estimation • Positive opinion • Negative opinion • news informal language Can vote age Weight Weak word = strong word
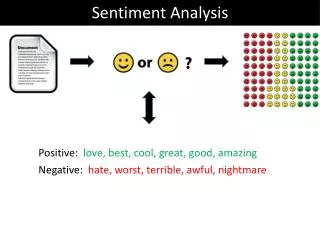
Sentiment analysis: word counting • Within topical messages • Count messages containing these positive and negative words • lexicon : 1200-1600 words marked as + or – • This list is not well suited for social media English • “sucks”, “: ) ”, “ : ( “
Sentiment ratio over Messages • For one day t and topic word, compute score
Sentiment Ratio Moving Average • High day-to-day volatility. • Average last k days • Keyword “jobs” • K = 1, 7, 30 • Gallup
Correlation Analysis: • Smoothed comparisons ,”jobs” sentiment Stock market go’s up Stock market Go’s down
Predicting polls Text sentiment is a poor predictor of consumer confidence L+K days are necessary to cover start of the text sentiment window
Presidential elections and job approval Sentiment ratio has negative correlate to the election r = -8% Looks easy : simple decline r=72.5% k= 15
"I Wanted to Predict Elections with Twitter and all I got was this Lousy Paper" -- A Balanced Survey on Election Prediction using Twitter DataD Gayo-Avello
Flaws in using Twitter Data for Election Prediction • It’s not prediction at all • Chance is not valid baseline • There is not a commonly accepted way of “counting votes” in Twitter • There is not a commonly accepted way of interpreting reality • Sentiment analysis are only slightly better than random classifiers • All the tweets are assumed to be trustworthy • Demographics are neglected • Self-selection bias is simply ignored
Recommendations for using Twitter Data for Election Prediction • There are elections virtually all the time, thus, if you are claiming you have a prediction method you should predict an election in the future! • Check the degree of influence incumbency plays in the elections you are trying to predict. Your baseline should not be chance but predicting the incumbent will win. Apply that baseline to prior elections Small amount of data available All elections are not important like presidential election
Recommendations for using Twitter Data for Election Prediction • Clearly define which is a “vote” and provide sound and compelling arguments supporting your definition. • Clearly define the golden truth you are using. use the “real thing” Why are you using some of the users? or not? How filter your data?
Recommendations for using Twitter Data for Election Prediction • Sentiment analysis is a core task. • We should first work on sentiment analysis in politics before trying to predict elections. • Credibility should be a major concern. • Remove spammers
Recommendations for using Twitter Data for Election Prediction • adjust your prediction: • the participation of the different groups in the prior election’s you are trying to predict • the belonging of users to each of those groups. • The silent majority is a huge problem.
Relevant prior Art Bollen : “we assess the validity of our sentiment analysis by examining the effects of particular events, namely the U.S. Presidential election of November 4, 2008, and the Thanksgiving holiday in the U.S., on our time series. “ application of mood (not sentiment) • Modeling Public Mood and Emotion: Twitter Sentiment and Socio- Economic Phenomena Bollen, J., Pepe, A., and Mao, H. 2009. • Definition of data and mood assessment • Data cleaning, parsing ad normalization • Time series production: aggregation of POMS mood scores over time This paper dose not describe any predictive method Used US 2008 Obama Election , no conclusions are inferred regarding the predictability of election
Relevant prior Art • Paper 2(From Tweets to Polls ) No correlation was found between electoral polls and Twitter sentiment data
Relevant prior Art • Predicting Elections with Twitter: What 140 Characters Reveal about Political Sentiment Tumasjan, A., Sprenger, T.O., Sandner, P.G., and Welpe, I.M. 2010. • Used LIWC for analysis of the tweets related to different parties running (German 2009 election) • Only count of tweets mentioning a party or candidate accurately predicted the election results • they claim that the MAE of the “prediction” based on Twitter data was rather close to that of actual polls.
Relevant prior Art • Why the Pirate Party Won the German Election of 2009 or The Trouble With Predictions: A Response to previous slide Jungherr, A., Jürgens, P., and Schoen, H. 2011. • method by Tumasjan et al. was based on arbitrary choices • not taking into account all the parties running for the elections but just those represented in congress • results varied depending on the time window used to compute them.
Relevant prior Art • Where There is a Sea There are Pirates: AResponse to previous slide Tumasjan, A., Sprenger, T.O., Sandner, P.G., and Welpe, I.M. 2011. • Twitter data is not to replace polls but to complement them
Relevant prior Art • Understanding the Demographics of Twitter Users Mislove, A., Lehmann, S., Ahn, Y.Y., Onnela, J.P., and Rosenquist, J.N. 2011. • The methods applied are simple but quite compelling • All of the data was inferred from the users profiles This is consistent with some of the findings ofGayo-Avello [8]