Download
1 / 45
460 likes | 480 Views
Sentiment Analysis. Kristina Lerman University of Southern California. How do people feel about movies?. Estimate this…. …using only this!. Huge interest, but why?. Help consumers and brands understand the opinions being expressed about Events Court decisions, protests, acts of congress

E N D
Sentiment Analysis Kristina Lerman University of Southern California CS 599: Social Media Analysis University of Southern California
How do people feel about movies? Estimate this… …using only this!
Huge interest, but why? • Help consumers and brands understand the opinions being expressed about • Events • Court decisions, protests, acts of congress • Products • Movies, consumer electronics • People • Political candidates, Dictators • Locations • Restaurants, hotels, vacation destinations
Mood and emotion • Moods are physiological in origin • Influenced by levels of neurotransmitters, hormones, … • Moods also depend on external factors • Daily routing, work, commuting, eating, … • Products used by a person • Two dimensions of mood • Positive affect • Enthusiasm, delight, activeness, alertness, happiness, … • Negative affect • Distress, fear, anger, guilt, disgust, sadness, … • Can we accurately measure mood from text?
Main ideas • Text messages (tweets, blog posts) use distinctive words to convey emotions • Identify features (words, linguistic features) that are highly indicative of emotions • Train classifier to recognize emotion in text • Supervised machine learning • Need labeled data to train classifier • Features are noisy. How to filter them to improve classifier performance? • What classifier to use? • Automatically classify the emotion of a new text message using only the features of the message
Recognizing blog moods “ESSE: Exploring mood on the Web” by Sood and Vasserman • Main idea • Current search engines are able to find content on the web efficiently but do little to connect the user and content with emotion. • Searching for a blog post based on keywords simply returns the posts most associated with those words, but the emotional nature of the posts is not considered. • Train a classifier to recognize the emotion in texts • Contributions • Training data collected from LiveJournal, with user-labeled emotions • Handling challenges: noisy labels
ESSE: Emotional State Search Engine • Searches an index of blogs for key terms • Allows the user to search based on one or more emotions as well as choose a source of indexed blogs
Classification • Train classifier to recognize the mood of LiveJournal posts • Training phase • More than 600,000 posts, each represented as a feature vector • Each post labeled by author with one of 130 different moods • Naïve Bayes classifier relates post with its label (user indicated mood) • Test phase • Classifier labels a new post with a mood
Classification (cont) • But, classifier is prone to overfitting • Too many noisy labels, not enough generalization • Solution: use clustering to reduce the number of labels by collapsing related labels into one of 4 (happy, sad, angry, other) • K Means clustering was used to cluster the posts into 3 groups (happy, sad, or angry), removing the outliers and reducing the data set to 31 moods, or ~130,000 posts
K Means clustering • Each mood represented as a feature vector • Component of the vector is the number of times that feature occurred in all posts tagged with that mood • Moods “happy”, “sad” and “angry” are initial cluster centroids hyper gloomy happy sad giddy angry irate
K Means clustering • Iterate until no further change • Moods closest to cluster centroid are assigned to that cluster • Recalculate cluster centroid hyper gloomy happy sad giddy angry irate
Naïve Bayes classifier • The probability of a post being classified as class c, given a set of feature f is equal to the prior (P(c)) times the product of all possibilities of all features, given class c. • Post classified as most likely class, i.e., class c with highest conditional probability
ESSE query • After training, the ESSE system is able to search different given indexes • Index scores higher for words used frequently in a document but less so for words that are used frequently in many documents • Mood classification and filtering is performed on the fly
Evaluation R = posts relevant to C P = posts labeled with C
Evaluation TP = true positives FN FP = false positives TN = true negatives TP FP FN = false negatives TN
Sentiment of Twitter posts “Twitter as a Corpus for Sentiment Analysis and Opinion Mining” by Pak & Paroubek • Main idea • People widely use microblogging platforms (e.g., Twitter) to express opinions. Understanding opiniosns would be useful for marketing and social sciences • But, it is challenging to extract sentiment from microblog posts, because they are very short (e.g., 140 characters) • Contributions • Automatically collect training data from Twitter • Use linguistic features to automatically recognize the sentiment of posts • Positive, negative, objective
Twitter sentiment • Twitter posts often express opinions • Which posts express positive sentiment? Negative sentiment? • Posts are short: few words to go by to recognize an opinion
Sentiment classification • Train classifier to recognize positive and negative sentiment • But, need lots of training data containing posts expressing positive and negative opinions, as well as objective posts not expressing an opinion Training data collection • Query Twitter for posts containing • Happy emoticons… :-), :), =), :D, … positive posts • Sad emoticons… :-(, :(, =(, ;(, … negative posts • Links to news articles objective posts
Zipf law Distribution of word counts in the data set is a power-law
Subjective vs objective posts • Relative prevalence of POS tags across subjective posts (positive or negative) and objective posts “Wow”, “OMG” “I”, “he” “most”, “best” sub P obj “I found”, “you saw” person, place or thing
Negative vs Positive • Relative prevalence of POS tags across negative and positive posts • Prevalence has less discriminative power than for objective vs subjective posts “missed”, “bored” -ve “most”, “best” P +ve “whose”
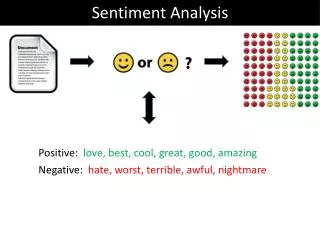
Supervised Machine Learning Sentiment Classifier Trojans Rule! input output Positive Labeled messages
Classifying the sentiment of tweets • Train the classifier • Features • Remove stop words, URLs • n-gram: sequence of n consecutive words from a post • binary (0,1) feature reflecting presence or absence of an n-gram • Filtering • Discard common n-grams, which are uniformly distributed across all data set. These don’t allow to discriminate between sentiments • Entropy of an n-gram g across different sentiments S. • High entropy g is evenly distributed across all sentiments
Example of calculating P(s|M) P(+|”trojans rule”) = P(+)* product of probabilities P(unigrams|+) = P(+) * P(“trojans”|+) * P(“rule”|+) =0.333 * 6/5000 * 22/5000 • Similarly for P(-|”trojans rule”) and P(obj|”trojans rule”) • Sentiment with the largest probability wins.
Results • Classify the sentiment of 200 messages. • Ground truth: messages were manually annotated for their sentiment precision F-measure recall # training samples
Summary • Authors of Twitter messages use linguistic features to describe emotions (positive or negative sentiment messages) or state facts (objective messages) • Some part-of-speech tags may be strong indicators of emotional text • Use examples of positive, negative, and objective messages collected from Twitter to train a classifier • Recognize sentiment of a new message based on its words and POS tags
Global mood patterns “Diurnal and seasonal moods vary with work, sleep and daylength across diverse cultures” by Golder and Macy • Can automated sentiment analysis be applied to social media data to provide a global picture of human mood? • Do moods have a time scale: diurnal, seasonal?
Corpus of Twitter tweets • Up to 400 public messages from each user • 2.4 million individuals worldwide • 509 million messages between 2/08-1/10 • 84 identified countries • English only • Date, Time, and country latitude
LIWC • Linguistic Inquiry and Word Count • James W. Pennabaker, U. Texas @ Austin • “Virtually no one in psychology has realized that low-level words can give clues to large-scale behaviors” • Recent book: The Secret Life of Pronouns (2011) • 4,500 words and word stems • Each in one or more word categories • “cried” in sadness, negative emotion, overall affect, verb, past tense verb. • 0.88 sensitivity and 0.97 specificity
Testing LIWC Online http://liwc.net/liwcresearch07.php
Methodology • Examined within-individual Positive Affect (PA) and Negative Affect (NA) independently, • E.g., fraction of PA words appearing in an individual’s messages every hour • To eliminate between-individual variation, subtract the mean: PAu*(h) = PAu(h) - <PAu(h)> • Additional analysis on 4 English-speaking regions: Africa, India, UK/Aus, US/Can
PA is higher when days are growing longer Small correlation No significant correlation
Digression: significance testing • “PA is higher when change in daylength is positive … (r=0.00121, p<0.001)” • Is there a trend? (measure correlation) • Calculate correlation: y vs x • Is the trend significant? Or can it be observed purely by chance? • Null-hypothesis: there is no trend • Calculate p-value
P-value • "reject the null hypothesis" when the p-value turns out to be less than a predetermined significance level • Significance level often set to 0.05 or 0.01 • Correlation values are normally distributed • P-value is the probability of falsely rejecting the null hypothesis
Summary • Confirm findings from psychological studies • Psychology studies are small scale, on homogeneous population vs Twitter study on large, heterogeneous population • Mood changes are associated with diurnal (sleep-wake) cycles • PA highest in the morning and before midnight • PA highest on weekends • Universal and independent of culture • Seasonal mood changes • PA decreases as days grow shorter “winter blues” • Possible to do psychology through text analysis of social media data