Download
1 / 1
10 likes | 152 Views
Pennacchietti et al. Suppl. Fig. 5. A. HGF conc. in blood. 2000. 1800. 1600. 1400. 1200. 1000. HGF conc. (pg/ml). WT SCID (mouse HGF). 800. hHGF KI SCID (human HGF). 600. 400. 200. 0. Plasma. Serum. B. HGF conc. in tissues. 4 000. 36 00. 32 00. 28 00. 24 00. 20 00.

E N D
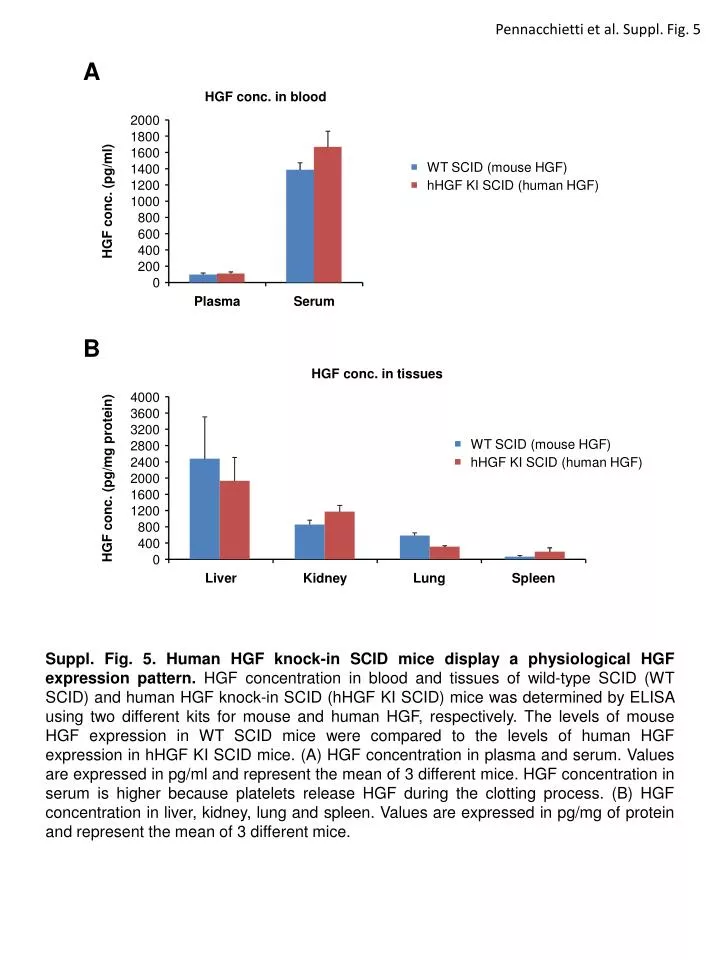
Pennacchietti et al. Suppl. Fig. 5 A HGF conc. in blood 2000 1800 1600 1400 1200 1000 HGF conc. (pg/ml) WT SCID (mouse HGF) 800 hHGF KI SCID (human HGF) 600 400 200 0 Plasma Serum B HGF conc. in tissues 4000 3600 3200 2800 2400 2000 HGF conc. (pg/mg protein) WT SCID (mouse HGF) 1600 hHGF KI SCID (human HGF) 1200 800 400 0 Liver Kidney Lung Spleen Suppl. Fig. 5. Human HGF knock-in SCID mice display a physiological HGF expression pattern. HGF concentration in blood and tissues of wild-type SCID (WT SCID) and human HGF knock-in SCID (hHGF KI SCID) mice was determined by ELISA using two different kits for mouse and human HGF, respectively. The levels of mouse HGF expression in WT SCID mice were compared to the levels of human HGF expression in hHGF KI SCID mice. (A) HGF concentration in plasma and serum. Values are expressed in pg/ml and represent the mean of 3 different mice. HGF concentration in serum is higher because platelets release HGF during the clotting process. (B) HGF concentration in liver, kidney, lung and spleen. Values are expressed in pg/mg of protein and represent the mean of 3 different mice.