Download
1 / 19
190 likes | 204 Views
Solving and Graphing Linear Inequalities. Solving One-Step Linear Inequalities. What’s an inequality?. Is a range of values , rather than ONE set number An algebraic relation showing that a quantity is greater than or less than another quantity. Speed limit:. Symbols. Less than.

E N D
Solving and Graphing Linear Inequalities Solving One-Step Linear Inequalities
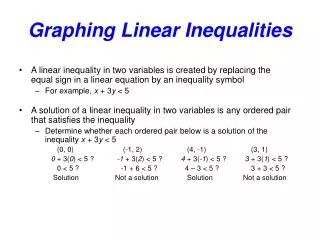
What’s an inequality? • Is a range of values, rather than ONE set number • An algebraic relation showing that a quantity is greater than or less than another quantity. Speed limit:
Symbols Less than Greater than Less than OR EQUAL TO Greater than OR EQUAL TO
-5 -4 -3 -2 -1 0 1 2 3 4 5 Solutions…. You can have a range of answers…… All real numbers less than 2 x< 2
-5 -4 -3 -2 -1 0 1 2 3 4 5 Solutions continued… All real numbers greater than -2 x > -2
-5 -4 -3 -2 -1 0 1 2 3 4 5 Solutions continued…. All real numbers less than or equal to 1
-5 -4 -3 -2 -1 0 1 2 3 4 5 Solutions continued… All real numbers greater than or equal to -3
Did you notice, -5 -4 -3 -2 -1 0 1 2 3 4 5 -5 -4 -3 -2 -1 0 1 2 3 4 5 Some of the dots were solid and some were open? Why do you think that is? If the symbol is > or < then dot is open because it can not be equal. If the symbol is or then the dot is solid, because it can be that point too.
Distance Sue’s Time -5 -4 -3 -2 -1 0 1 2 3 4 5 Write and Graph a Linear Inequality Sue ran a 2-K race in 8 minutes. Write an inequality to describe the average speeds of runners who were faster than Sue. Graph the inequality. Faster average speed >
+3 +3 Solving an Inequality Solving a linear inequality in one variable is much like solving a linear equation in one variable. Isolate the variable on one side using inverse operations. Solve using addition: x – 3 < 5 Add the same number to EACH side. x < 8
-6 -6 Solving Using Subtraction Subtract the same number from EACH side.
-5 -4 -3 -2 -1 0 1 2 3 4 5 Using Subtraction… Graph the solution.
-5 -4 -3 -2 -1 0 1 2 3 4 5 Using Addition… Graph the solution.
THE TRAP….. When you multiply or divide each side of an inequality by a negative number, you must reverse the inequality symbol to maintain a true statement.
(2) (2) Solving using Multiplication Multiply each side by the same positive number.
3 3 Solving Using Division Divide each side by the same positive number.
(-1) (-1) See the switch Solving by multiplication of a negative # Multiply each side by the same negative number and REVERSE the inequality symbol. Multiply by (-1).
-2 -2 Solving by dividing by a negative # Divide each side by the same negative number and reverse the inequality symbol.
Homework Page 337 – 338 # 22-54 evens 55-60 61 & 65