Download
1 / 27
270 likes | 276 Views
Chapter 6 Solving and Graphing Linear Inequalities. 6.1 Solving One-Step Linear Inequalities. Objective: Graph linear inequalities in one variable Solve one-step linear inequalities. Terms. Graph. Rules. Inequalities Use the same rules that you use to solve equations.

E N D
6.1 Solving One-Step Linear Inequalities Objective: Graph linear inequalities in one variable Solve one-step linear inequalities
Terms • Graph
Rules • Inequalities • Use the same rules that you use to solve equations. • Starting your Graph • If you have a > or < use an open circle • If you have a > or < use a closed circle • Drawing the line • Pick a test point. • If the test point is true draw your line so that it crosses the test point • If your test point is false draw your line away from the test point • Special Cases • When you multiply or divide by a negative you have to flip the inequality sign.
X > -2 -10 < -x X – 5 > 1 5 + x > -5 Practice
15p < 60 -10a > 100 -a< -2 10 5 + x > -5 Practice
White Board Practice • One person from each row get materials for white board practice
6.2 Solving Multi-Step Linear Inequalities Objective: Solve multi-step linear inequalities Use linear inequalities to model and solve real-life problems
Things to Remember • If you have a > or < use an open circle • If you have a > or < use a closed circle • When you multiply or divide by a negative you have to flip the inequality sign. • Use order of operations in reverse to solve multi-step inequalities
X + 5 > -13 2(x-8) > -x + 4 15 – x < 7 - ½ x + 3 < 7 Practice
6.3 Solving Compound Inequalities Objective: Write, solve, and graph compound inequalities model a real-life problem with a compound inequality
Terms • Compound inequality
Rules • Solve each inequality separately • Graph each inequality on the same number line • If it is an AND graph • SHADE WHERE THEY CROSS • If it is an OR graph • DO NOT SHADE
6 < x – 6 < 8 6 + 2x > 20 or 8 + x < 0 -4 < 2 + x < 1 3x + 8 > 17 or 2x + 5 < 7 Practice
6.3 Solving Compound Inequalities Part 2 Objective: Write, solve, and graph compound inequalities model a real-life problem with a compound inequality
2nd hour Ws 6.2 Brandon Blystone Dalton Mix Breanna Olinger Kyle Reed Cole Robertson Josh Thomas WS 6.3 Brandon Blystone Pre-Test Jonathan Crabb Cody Wheat Jeremy Wiggins 5th Hour Ws 6.1 AJ Knobelauch Ws 6.2 AJ Knobelauch Ws 6.3 Kristin Burnett AJ Knobelauch Ashlee Lewis Pre-Test Kristin Burnett Missing Assignments
Rules • Solve each inequality separately • Graph each inequality on the same number line • If it is an AND graph • SHADE WHERE THEY CROSS • If it is an OR graph • DO NOT SHADE
Practice problems • 3n + 3 > 24 or 5n - 3 < 25 • -43 < 3x – 10 < -19
Practice problems • 5x – 10 > 5 or 10n - 30 < 120 • 15 < 3x – 9 < 21
6.4 Solving Absolute Value Equations and Inequalities Objective: Solve absolute value equations Solve absolute value inequalities
Terms • Absolute Value • And graph • Or graph
Rules • Get rid of absolute value by making 2 problems • Determine the type of graph (and or or) • Solve both equations • Graph the answers on one number line
I x I = 8 I x – 5 I = 7 I x + 3 I < 8 I 3x + 2 I – 1> 10 Practice
White Board Practice • One person from each row get materials for white board practice
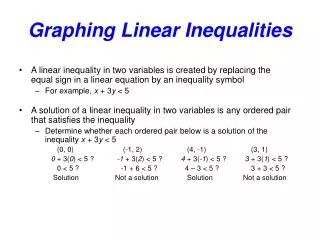
6.5 Graphing Linear Inequalities in 2 Variables Objective: Graph linear inequalities in two variables
6.6 Stem-and-Leaf Plots and Measures of Central Tendency Objective: Make and use a stem-and-leaf plot Find the measures of central tendency