Download
1 / 1
20 likes | 153 Views
4. Delay. 3. Inspection. Operator. 2. Transport. Inspection. Transport. Delay. 1. Operations. 0. 1. 4. 7. 10. 13. 16. 19. 22. 25. 28. 31. 34. 37. 40. Process Activity Mapping project Clinical Biochemistry Royal Gwent Hospital.

E N D
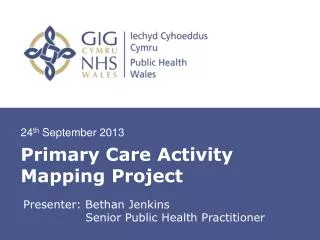
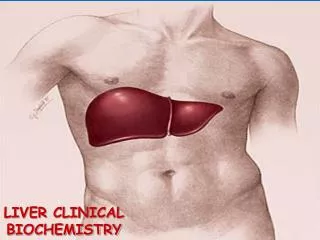
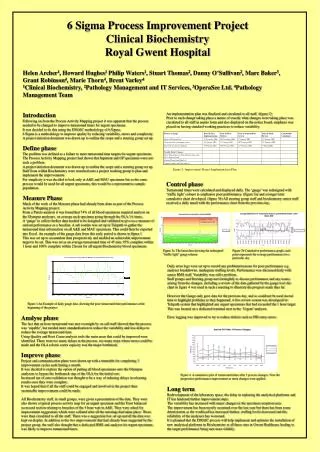
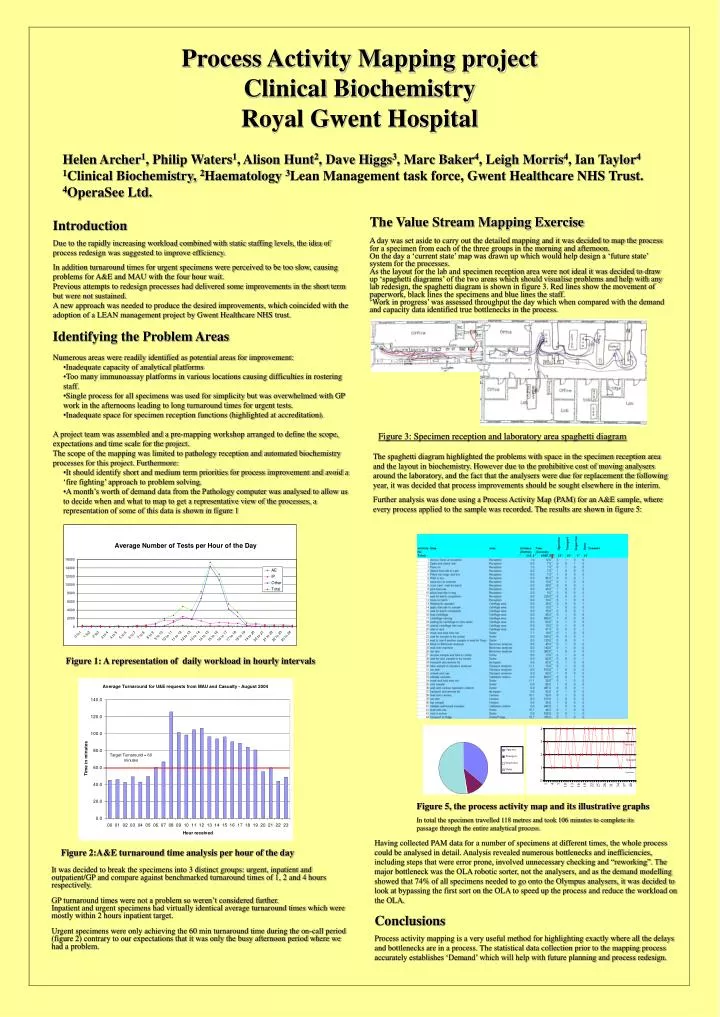
4 Delay 3 Inspection Operator 2 Transport Inspection Transport Delay 1 Operations 0 1 4 7 10 13 16 19 22 25 28 31 34 37 40 Process Activity Mapping projectClinical Biochemistry Royal Gwent Hospital Helen Archer1, Philip Waters1, Alison Hunt2, Dave Higgs3, Marc Baker4, Leigh Morris4, Ian Taylor4 1Clinical Biochemistry, 2Haematology 3Lean Management task force, Gwent Healthcare NHS Trust. 4OperaSee Ltd. The Value Stream Mapping Exercise A day was set aside to carry out the detailed mapping and it was decided to map the process for a specimen from each of the three groups in the morning and afternoon. On the day a ‘current state’ map was drawn up which would help design a ‘future state’ system for the processes. As the layout for the lab and specimen reception area were not ideal it was decided to draw up ‘spaghetti diagrams’ of the two areas which should visualise problems and help with any lab redesign, the spaghetti diagram is shown in figure 3. Red lines show the movement of paperwork, black lines the specimens and blue lines the staff. ‘Work in progress’ was assessed throughput the day which when compared with the demand and capacity data identified true bottlenecks in the process. • Introduction • Due to the rapidly increasing workload combined with static staffing levels, the idea of process redesign was suggested to improve efficiency. • In addition turnaround times for urgent specimens were perceived to be too slow, causing problems for A&E and MAU with the four hour wait. • Previous attempts to redesign processes had delivered some improvements in the short term but were not sustained. • A new approach was needed to produce the desired improvements, which coincided with the adoption of a LEAN management project by Gwent Healthcare NHS trust. • Identifying the Problem Areas • Numerous areas were readily identified as potential areas for improvement: • Inadequate capacity of analytical platforms • Too many immunoassay platforms in various locations causing difficulties in rostering staff. • Single process for all specimens was used for simplicity but was overwhelmed with GP work in the afternoons leading to long turnaround times for urgent tests. • Inadequate space for specimen reception functions (highlighted at accreditation). • A project team was assembled and a pre-mapping workshop arranged to define the scope, expectations and time scale for the project. • The scope of the mapping was limited to pathology reception and automated biochemistry processes for this project. Furthermore: • It should identify short and medium term priorities for process improvement and avoid a ‘fire fighting’ approach to problem solving. • A month’s worth of demand data from the Pathology computer was analysed to allow us to decide when and what to map to get a representative view of the processes, a representation of some of this data is shown in figure 1 Figure 3: Specimen reception and laboratory area spaghetti diagram The spaghetti diagram highlighted the problems with space in the specimen reception area and the layout in biochemistry. However due to the prohibitive cost of moving analysers around the laboratory, and the fact that the analysers were due for replacement the following year, it was decided that process improvements should be sought elsewhere in the interim. Further analysis was done using a Process Activity Map (PAM) for an A&E sample, where every process applied to the sample was recorded. The results are shown in figure 5: Figure 1: A representation of daily workload in hourly intervals Figure 5, the process activity map and its illustrative graphs In total the specimen travelled 118 metres and took 106 minutes to complete its passage through the entire analytical process. Having collected PAM data for a number of specimens at different times, the whole process could be analysed in detail. Analysis revealed numerous bottlenecks and inefficiencies, including steps that were error prone, involved unnecessary checking and “reworking”. The major bottleneck was the OLA robotic sorter, not the analysers, and as the demand modelling showed that 74% of all specimens needed to go onto the Olympus analysers, it was decided to look at bypassing the first sort on the OLA to speed up the process and reduce the workload on the OLA. Figure 2:A&E turnaround time analysis per hour of the day It was decided to break the specimens into 3 distinct groups: urgent, inpatient and outpatient/GP and compare against benchmarked turnaround times of 1, 2 and 4 hours respectively. GP turnaround times were not a problem so weren’t considered further. Inpatient and urgent specimens had virtually identical average turnaround times which were mostly within 2 hours inpatient target. Urgent specimens were only achieving the 60 min turnaround time during the on-call period (figure 2) contrary to our expectations that it was only the busy afternoon period where we had a problem. Conclusions Process activity mapping is a very useful method for highlighting exactly where all the delays and bottlenecks are in a process. The statistical data collection prior to the mapping process accurately establishes ‘Demand’ which will help with future planning and process redesign.