Download
1 / 25
250 likes | 345 Views
Predicting FTEs. Jason Vander Weele, Analyst Lakeshore Technical College April 24, 2014 Madison College IR State-Called Meeting. Define. What are we talking about? Why are we modeling?. Define: The Challenge. Budgeting for FTEs has been difficult Process historically involves:

E N D
Predicting FTEs Jason Vander Weele, Analyst Lakeshore Technical College April 24, 2014 Madison College IR State-Called Meeting
Define • What are we talking about? • Why are we modeling?
Define: The Challenge • Budgeting for FTEs has been difficult • Process historically involves: • College goals • Multiple meetings, reports, discussions
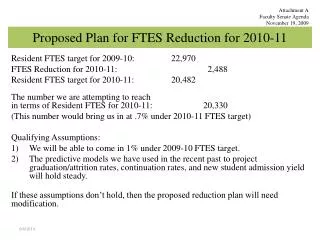
Define: The Opportunity • LTC Research and Planning asked to “figure out a way” • A real need to take “goals” out of the equation, to get closer to “expected” outcomes • Want a baseline BUDGETARY FTE value There are disincentives for the college to suggest a declining enrollment
Define: The Goal • Develop model to predict FTEs • Ability to refresh model as data becomes available • Predict 15 months out (Predict in February for end of next school year)
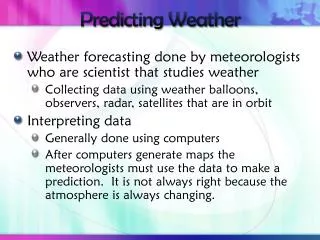
Define: Beliefs • You can’t predict enrollment • Every day predictions are made – the weather, credit risk, ball games • We should only use predictors we can control • If controllable variables are the best predictors, then why not > 20,000 FTEs per college? • People will stop trying if we put out a prediction • The predictions rely on people giving the same efforts they’ve always given
Define: What are FTEs, anyway? • At abasic level, FTEs are a function of the people in a district who attend classes at our school • “People in a district” – who are they? • Depends on the population • Depends on demographics • “Who attend classes at our school” – what factors affect this? • Depends on personal life (employment, kids, attitudes, beliefs) • Depends on demographic (education, age, gender)
Measure • What are things we can measure to help us understand FTEs?
Measure: Some Variables • Identify data that we can use that may or may not be a good predictor of FTE • Gather population data (age, gender, ethnicity) • Gather high school graduation numbers • Gather unemployment data
Analyze: The Steps 1) Collect data 2) Run Multiple Linear Regression with all variables 3) Identify variables with highest importance to fit line 4) Check validity 5) Conduct simulation 6) Perform sensitivity analysis
Analyze: Step 1 Collect Data • Plus, FTE Final Values
Analyze: Multiple Linear Regression Cont’d This, after many iterations and assumption testing 2012-13 FTEs = -326.959 + 131.104 X UnemploymentRateManitowoc + 0.291 X PopulationManitowoc15to19YearOlds
Analyze: What do we get?!? 2012-13 FTEs = -326.959 + 131.104 X UnemploymentRateManitowoc +0.291 X PopulationManitowoc15to19YearOlds
Analyze: How Precise are We? • Trend is described by Bias = -20 or Ave Bias = -2.2 • The trend is negative, meaning over the observed period of 9 years, the model was 20 FTEs higher than actual • Variation is described by the Mean Absolute Deviation (MAD) = 11.33 (an approximation of sigma) • Therefore, there is a 98% probability that the next actual value will fall within 3*MAD = +/-34
Analyze: How Precise are We? • Thus, considering the bias and the MAD we can state that the model will predict FTEs within the range of -31.8 to 36.2 with a probability of 98% • Therefore, we should expect to observe an error range of -1.44 to 1.64% for any actual value when compared to the model. • Over the period analyzed the actual error rate range was -1.24 to 0.40%
Analyze: Is That Good? (PRELIMINARY) In September/October 2013:
Analyze: Variation of Predictors • What about variation of the predictors???
Improve: Overview for Future • This is our baseline • Begin the forecasting process • Leads into the budgeting process
Improve: Get Better • Training data • Testing data • Bigger sample • Expand look at other variables • Deeper understanding, analysis, and interpretation
Control: Process Consistency • Automate the analysis – on demand? • Look backwards and forwards to validate change over time • Focus on BIAS and MAD as a check
Thank you! LTC would be happy to share more details about the model as requested.