Download
1 / 15
150 likes | 300 Views
Mean Deviation. Standard Deviation. Variance. 9 values below. 9 values above. 9 values below. 9 values above. Below is listed the test results of 2 different classes. It is human nature to compare these results. How can we compare the results of one class to that of another?.

E N D
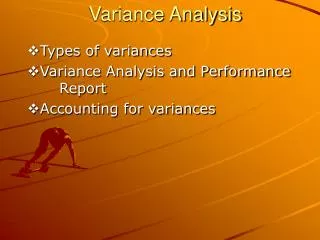
Mean Deviation Standard Deviation Variance
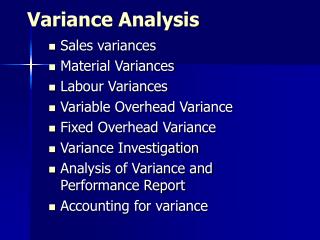
9 values below 9 values above 9 values below 9 values above Below is listed the test results of 2 different classes. It is human nature to compare these results. How can we compare the results of one class to that of another? Class A: 52, 59, 60, 62, 64, 65, 68, 72, 80, 82, 82, 84, 86, 87, 88, 90, 91, 95, 96 Class B: 44, 49, 55, 57, 61, 66, 71, 74, 81, 82, 82, 83, 85, 90, 92, 94, 98, 99, 100 Perhaps the quickest measure of central tendency is to observe the most frequent mark for each class. In Class A the mark of 82% occurs twice whereas the other marks only occur once. In Class B the exact same thing happens. For this reason this method is unsatisfactory. This measure of central tendency is called the MODE. It has the advantage of being very easy and relatively quick to determine but it is not very helpful in many situations as it can often be very misleading. Another way to compare classes is to compare the middle value from each class. Since both classes have 19 values, we are looking for the tenth value (there are 9 values below and 9 values above. Class A: 52, 59, 60, 62, 64, 65, 68, 72, 80, 82, 82, 84, 86, 87, 88, 90, 91, 95, 96 Class B: 44, 49, 55, 57, 61, 66, 71, 74, 81, 82, 82, 83, 85, 90, 92, 94, 98, 99, 100 This is called the MEDIAN. 82 for both here as well. This method is a little more time-consuming especially if the numbers are not in order as they are here. The Median is generally a more reliable measure of central tendency than the Mode.
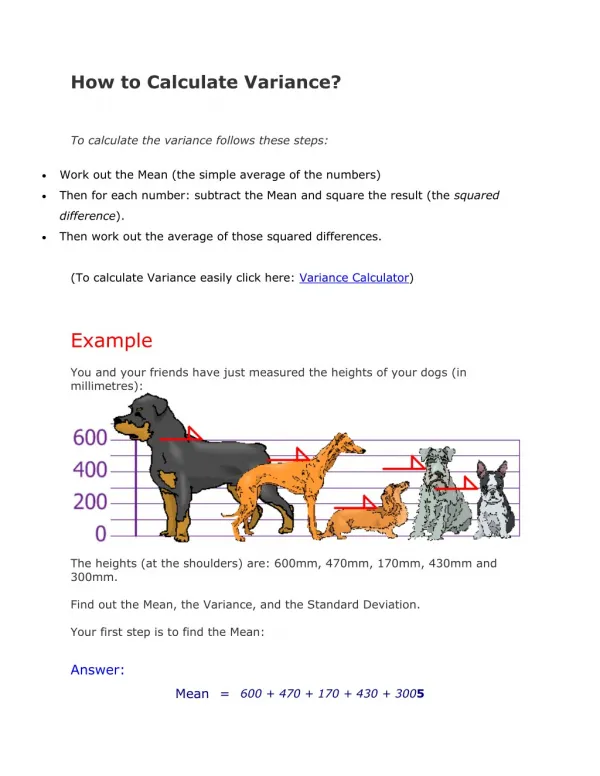
The third and perhaps most common measure of central tendency is the MEAN. This is also known as the average or the arithmetic mean. It is also the most tedious value to determine – especially with a lot of values because you have to add them all up. Lets assign each value in a class to variable ‘x’. So in Class A, x1 = 52, x2 = 59, x3 = 60 and x19 = 96. When we look at the values in this way we can express the sum of the values like so: This is a very cumbersome way to express the sum of the data values. There is a special symbol used in statistics to represent the sum of data values. We can read this symbol as follows: The sum of xi, where x ranges from ‘i’ to ‘n’. ‘n’ represents the total number of data values. = 52+59+60+62+64+65+68+72+80+82+82+84+86+87+88+90+91+95+96 Even though that symbol may be weird and foreign to you, which would you prefer to write: the weird symbol on the left side of the ‘=‘ or the sum of the 19 numbers on the right. One more point – sometimes it can be the sum of more than 19 numbers. One of the reasons that we have to write it is to express the formula for MEAN. By the way, since we are using variable ‘x’ to represent the individual marks, we will use the following symbol to represent the MEAN of the marks:
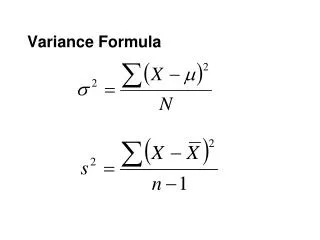
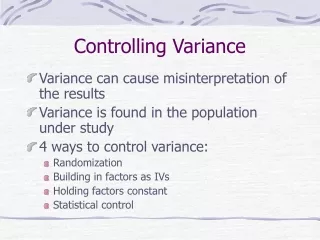
The formula to determine MEAN from a set of values is: Where n represents the total data values Class A: 52, 59, 60, 62, 64, 65, 68, 72, 80, 82, 82, 84, 86, 87, 88, 90, 91, 95, 96 Class B: 44, 49, 55, 57, 61, 66, 71, 74, 81, 82, 82, 83, 85, 90, 92, 94, 98, 99, 100 We see that the mean ends up having the same value for both classes as well. None of the 3 measures of central tendency does anything to distinguish the results of one class from the results of another. There are other ways to make a distinction between the results of both classes than using central tendency. We can observe the VARIANCE. This is an indication of how spread out or dispersed the values are. It is a measure of how much the data values deviate from the arithmetic mean. The larger the variance, the greater the dispersion and the smaller the variance, the more clustered the data values.
The symbol for variance is: s2 To calculate variance, we really should do it step by step. 1. Calculate arithmetic mean To calculate variance, we really should do it step by step. 1. Calculate arithmetic mean 2. Calculate the difference between each data value and the mean To calculate variance, we really should do it step by step. 1. Calculate arithmetic mean 2. Calculate the difference between each data value and the mean 3. Square the result from step 2 To calculate variance, we really should do it step by step. 1. Calculate arithmetic mean 2. Calculate the difference between each data value and the mean 3. Square the result from step 2 4. Calculate the sum of all of the values from step 3 5. Divide the result of step 4 by (n – 1) To calculate variance, we really should do it step by step. 1. Calculate arithmetic mean 2. Calculate the difference between each data value and the mean 3. Square the result from step 2 4. Calculate the sum of all of the values from step 3
Class A Remember that the symbol for variance is s2 not s. We do not take the square root of 185.67 to determine variance. The variance is 185.67.
The variance for Class A is 185.67 as compared to the variance for Class B is 304.56. This indicates that the values are more spread out for Class B. You might say that the calculation we just did is unnecessary . We can determine that Class B is more spread out than Class A just by observing its range (lowest to highest value). Class A ranges from 52 to 96, a separation of 44. Class B ranges from 44 to 100, a difference of 56. Class B is more spread out. All of that is true but the variance is more revealing because it takes into consideration all of the values whereas range only takes 2 values from each class. Actually, due to the fact that the difference between the mean and each specific value is squared, the variance is not the best way to compare dispersion of the classes. To compensate for this fact, we can square root the variance. This allows the units measuring dispersion to be the same as the units for the class values. When we do this we get the STANDARD DEVIATION. The symbol for standard deviation is ‘s’. For Class A For Class B
The owner of 2 service stations decided to record the number of litres of gasoline needed to fill the tank of each car that stops at one of his service stations. One of the stations is located along the highway and the other is located downtown. Highway Service Station: 30, 22, 21, 28, 25, 26, 26, 24, 29, 23, 20, 27, 25, 24, 25 Downtown Service Station: 25, 23, 30, 19, 35, 27, 15, 25, 17, 31, 14, 20, 33, 25, 36 Highway Service Station
The owner of 2 service stations decided to record the number of litres of gasoline needed to fill the tank of each car that stops at one of his service stations. One of the stations is located along the highway and the other is located downtown. Highway Service Station: 30, 22, 21, 28, 25, 26, 26, 24, 29, 23, 20, 27, 25, 24, 25 Downtown Service Station: 25, 23, 30, 19, 35, 27, 15, 25, 17, 31, 14, 20, 33, 25, 36 Downtown Service Station
Box and Whiskers plot Highway Downtown 14 16 18 20 22 24 26 28 30 32 34 36 38 Number of litres From the box-and-whiskers plot the minimum and maximum from the highway station are 20 and 30 respectively. The minimum and maximum from the downtown station are 14 and 36 respectively. The quartiles (Q1, Q2, and Q3) are as follows: Q1 = 23 L Q2 (Md) = 25 L Q3 = 27 L Q1 = 19 L Q2 (Md) = 25 L Q3 = 31 L The semi-interquartile range is basically half of the interquartile range and it is the mean length of a quartile. About half of the values will fall between Md - Q and Md + Q Q3 = 27 L The interquartile range (IR) is: IR =Q3 – Q1 = 27 – 23 = 4 L IR =Q3 – Q1 = 31 – 19 = 12 L
Absolute value of There is one other measure that is used to determine the degree of dispersion of the data values from a group. We already have defined variance and standard deviation. The third device is called MEAN DEVIATION. This calculation is similar to standard deviation in that its units are the same as the data values given. But it is a little simpler than standard deviation formula. Observe the 2 formulas: This is the value of the difference with the negative sign removed if it is present. There are 3 differences between these 2 formulas. What are they? No square root in the formula for mean deviation. Mean deviation formula divides by n instead of (n-1).
15 Building 1 (m2) 36 48 38 52 12 22 42 35 24 45 48 Building 2 (m2) 36 42 24 46 28 36 39 37 Mr. White had carpeting installed in each of the 10 units in his 2 apartment buildings located on Stone Street. The following table shows the surface area covered in each unit. a) Calculate the standard deviation of the data collected for each building. Building 1: __________ Building 2: __________ b) Using standard deviation for each building, determine for which building the carpet area differs the most from one unit to the next. Explain. _________________________________ _________________________________ _________________________________ c) Would the variance have allowed you to draw the same conclusions? Why? _________________________________ _________________________________