Download
1 / 10
100 likes | 184 Views
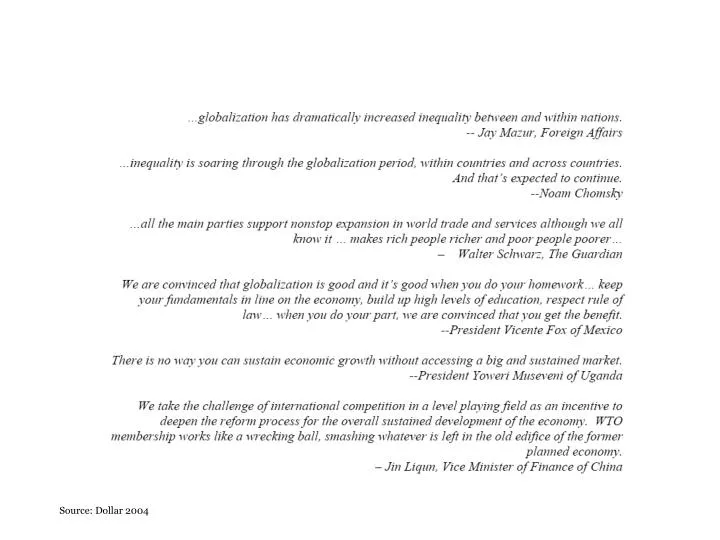
Source: Dollar 2004. « Growth is good for the poor ». Unit of observation: country (over long period). Income growth for the 20% poorest. Average income growth. Source: Dollar and Kray (2001). Cross-country determinants of poverty.

E N D
« Growth is good for the poor » Unit of observation: country (over long period) Income growth for the 20% poorest Average income growth Source: Dollar and Kray (2001)
Cross-country determinants of poverty Note: For details of the estimation and other results see Chen (2003). All estimations reported use ordinary least squares. The endogenous variable in all regression is the poverty gap. A “*” denotes significance at the 10 percent level, “**” at the 5 percent level and “***” at the 1 percent level. Standard errors are White Robust. Sample: 24 low-income countries, 1987-96 Source : Olarreaga & Nicita (2004), « Poverty », Ethiopia DTIS.
Income distribution over time: World, 1970-80 Source: Sala i Martin 2002
Income distribution over time: World 1990-98 Source: Sala i Martin 2002
Poverty: tide turning? Headcount of individuals living on less than $1 a day worldwide First time! million individuals Source: World Bank (2002),"Globalization, Growth and Poverty:Building an Inclusive World Economy"
and more trade doesn’t imply more inequality Unit of observation: country (over long period) Source: Dollar (2001) figure 12
Dependant variable: household per-capita income Micro-economic determinants of poverty: household survey evidence
Effet d’une restriction sur le travail des enfants: analyse traditionnelle Salaire, produit marginal Offre après taxe Offre de travail juvénile des familles taxe salaire d’équil. Demande par les employeurs Emploi enfants
Travail des enfants: le modèle de Basu et Hoang Wan wA C salaire suffisant, pas besoin de mettre les enfants au travail Demande de travail effectif: n f’(Ai+ γ Ci ) = wA B’ wA = 2s B A Travail effectif N (1+ γ)N # adultes # enfants divisé par 2 (puisque productivité moitié moindre)


![[f´‚nE˘RIks]](https://cdn0.slideserve.com/636013/f-ne-riks-dt.jpg)