Download
1 / 16
160 likes | 242 Views
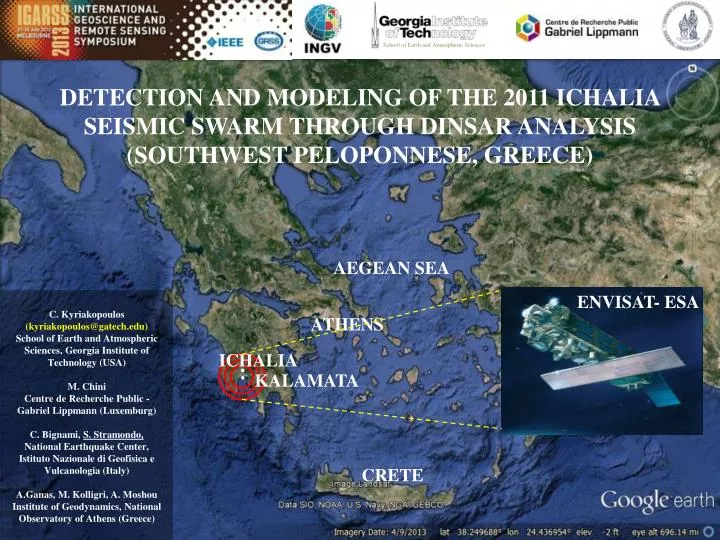
School of Earth and Atmospheric Sciences. DETECTION AND MODELING OF THE 2011 ICHALIA SEISMIC SWARM THROUGH DINSAR ANALYSIS (SOUTHWEST PELOPONNESE, GREECE). AEGEAN SEA. ENVISAT- ESA. C. Kyriakopoulos (kyriakopoulos@gatech.edu)

E N D
School of Earth and Atmospheric Sciences DETECTION AND MODELING OF THE 2011 ICHALIA SEISMIC SWARM THROUGH DINSAR ANALYSIS (SOUTHWEST PELOPONNESE, GREECE) AEGEAN SEA ENVISAT- ESA C. Kyriakopoulos (kyriakopoulos@gatech.edu) School of Earth and Atmospheric Sciences, Georgia Institute of Technology (USA) M. Chini Centre de Recherche Public - Gabriel Lippmann (Luxemburg) C. Bignami, S. Stramondo, National Earthquake Center, Istituto Nazionale di Geofisica e Vulcanologia (Italy) A.Ganas, M. Kolligri, A. Moshou Institute of Geodynamics, National Observatory of Athens (Greece) ATHENS ICHALIA KALAMATA CRETE
School of Earth and Atmospheric Sciences REGIONAL SEISMIC HAZARD MAP This region was recognized in previous studies as an area of high seismic potential (Papazachos et al. 1986; Armijo et al. 1991).
School of Earth and Atmospheric Sciences TECTONIC SWARMS: DEFINITION AND PREVIOUS EXAMPLES OF DInSAR USE EARTHQUAKE SWARMS: sequences of earthquakes clustered in time and space, lacking a clear main shock (Mogi 1963; Sykes 1970; Hill 1977), covering an unusually large spatial area relative to their total seismic moment release, and failing to decay in time according to standard aftershock scaling laws distinctive of main shock and aftershocks (Roland & McGuire 2009). OBSERVED IN A VARIOUS RANGE OF GEOLOGICAL SETTINGS: volcanic (Bianco et al. 2004; Guglielmino et al. 2011) geothermal regions (Dziak et al. 2003) along transform plate boundaries and active rift zones (Baer et al. 2008; Pallister et al. 2010) associated with surface fault scarps and extensional cracks (Pollard et al. 1983; Rubin & Pollard 1988).
SUMMARY WHEN: In the period 2011 June–October, a tectonic swarm of nearly 1222 earthquakes occurred. WHERE:The swarm occurred in the Messenia’s Upper Quaternary basin, 25 km NW of the city of Kalamata, and migrated from NNW towards SSE. EVENTS: The largest earthquakes occurred in 2011 August 14 (Mw = 4.8), September 14 (Mw = 4.6) and October 10 (Mw = 4.7), caused moderate structural damages mainly in old houses in four villages and produced particular unrest to the local population. TECHNIQUE: We have investigated the monthly migration of the swarm using Differential Synthetic Aperture Radar Interferometry (DInSAR), presenting a very close look at the deformation evolution that may reveal an aseismic slip component of the total movement. RESULTS: The geodetically derived slip distribution for the first 4 months revealed that slip migrated laterally along strike (north to south) and vertically from a deep portion, at ∼2.8 km depth, to a shallow portion, at less than 0.5 km, of the fault plane, and concluded its migration towards the surface with a very shallow Mw 4.7 event of 2011 October 10.
LATERAL MIGRATION OF THE SEISMIC SWARM (NNE-SSW DIRECTION) JULY 3 – OCTOBER 31 OBSERVED SEISMICITY and SWARM MIGRATION SEISMIC MOMENT EVOLUTION and AVAILABLE SAR IMAGES From Kyriakopoulos et al., 2013, Geoph. J. Int
DInSAR PROCESSING • The ENVISAT interferograms were computed by applying a 1 × 5 multilook factor; • The 90-m Shuttle Radar Topography Mission (SRTM) DEM has been used to remove the topographic contribution;
MOST RELEVANT INTERFEROGRAMS JULY AUGUST SEPTEMBER OCTOBER D C A B AUG+SEPT JUL+AUG+SEPT JUL+AUG+SEPT+OCT NOV+DEC F E G H From Kyriakopoulos et al., 2013, Geoph. J. Int
DISLOCATION MODELLING We inverted the deformation field of by using a distribution of finite sources (patches) embedded in an elastic, isotropic, semi-infinite half-space (Okada, 1985) and we obtained the slip distribution for corresponding models: The fault parameters for the generated models are fixed using the available data sets, e.g. moment tensors, interferograms, geologic map (DIP=50, STRIKE=162, RAKE=-70). NNW Strike Direction The fault planes are segmented into rectangular 34 × 20 patches of 500 m size. A Green’s function matrix is composed by imposing 1 m of slip on each patch and collecting the E, N and up component projected into the ENVISAT LoS. The linear inversion is performed adopting the Occam’s smoothing regularization scheme (deGroot-Hedlin&Constable 1990), minimizing the chi-square and the roughness matrix (smoothing operator) and imposing positivity constraints (only normal component allowed). Dip Direction SSE 50° The fault model discretized in patches
ESTIMATED SLIP MIGRATION DURING THE JULY 3 – OCTOBER 31 PERIOD (Mgeod. > Mo, μ=30 GPa) • JULY 3 - SEPTEMBER 1 • SEPTEMBER 1 - OCTOBER 1 • OCTOBER 1 - OCTOBER 31 • AUGUST 2 - OCTOBER 1 • JULY 3 - OCTOBER 1 From Kyriakopoulos et al., 2013, Geoph. J. Int
OBSERVED (UNWRAPPED PHASE) DEFORMATION IN: MODELED DIFFERENCES AUGUST SEPTEMBER OCTOBER AUGUST + SEPTEMBER JULY + AUGUST + SEPTEMBER
SURFACE BREAKS REPORTED INSIDE VILLAGE SIAMO AFTER THE Mw 4.8 AUG 14 NNW-SSE Images from A.Ganas (NOA, Athens) The interferometric results are in agreement with the location of tensile surface breaks, observed after the August 14 event, reported by Ganas et al. (2012) in the area of Siamo village (along the eastern margin of the basin), aligned in an NNW–SSE direction. The breaks were discontinuous, en echelon and about 500m long. Most breaks exhibit minor throw to the west.
SURFACE BREAKS REPORTED INSIDE VILLAGE SIAMO AFTER THE Mw 4.8 AUG 14 Images from A.Ganas (NOA, Athens)
SURFACE BREAKS FROM THE Mw4.7 OCT10 EVENT Surface breaks in the area north of Krassopoula village, (Diaselo site) mapped during 2012 June and 2013 January and oriented NNW–SSE and 80-m long. The surface breaks area is spatially correlated with the surface deformation pattern mapped with DInSAR (October interferograms). Immediate prolongation of the west-dipping normal fault mapped by Ganas et al. (2012).
SURFACE BREAKS FROM THE Mw4.7 OCT10 EVENT Surface breaks in the area north of Krassopoula village, (Diaselo site) mapped during 2012 June and 2013 January and oriented NNW–SSE and 80-m long. The surface breaks area is spatially correlated with the surface deformation pattern mapped with DInSAR (October interferograms). Immediate prolongation of the west-dipping normal fault mapped by Ganas et al. (2012).
CONCLUSIONS This study presents three main observations. 1- seismic swarm migrates towards the south with shallower slip. The temporal evolution of the surface displacement pattern is well documented and seems to be in phase with the seismicity propagation. All the interferograms covering the July 3–October 31 period suggest the activation of a normal fault or a system of normal faults that runs parallel to the western front of Taygetos mountain range. 2- seismic and geodetic moments are different (both calculated for μ = 30 GPa). In our case, both the cumulative slip models, ModAO1 [M(w)g 5.45)] and ModJO [(M(g)w 5.3], predict a larger moment compared to the cumulative seismic moment for the interval July 3–October 1 (Mw 4.9), suggesting an ongoing region-wide aseismic creep over the same period. 3- relatively large surface displacement measured in the period October 1–October 31. Although the seismicity has average magnitude comparable with those measured in the period July 3–October 1, the maximum surface displacement is much larger (∼6 fringes) and concentrated in a well-localized area of about 4 × 2.5 km indicating a very shallow seismogenesis.