Download
1 / 24
250 likes | 347 Views
A natural experiment: The Mt. Pinatubo eruption; net flux; time constants; and the ERB. Professor John Harries, Space and Atmospheric Physics group, Blackett Laboratory, Imperial College, London, UK. Work reported in Harries and Futyan GRL, 33 , L23814, 2006

E N D
A natural experiment: The Mt. Pinatubo eruption; net flux; time constants; and the ERB Professor John Harries, Space and Atmospheric Physics group, Blackett Laboratory, Imperial College, London, UK GIST May 2007
Work reported in Harries and Futyan GRL, 33, L23814, 2006 Acknowledge provision of data by Prof. Brian Soden, U.Miami, USA] GIST May 2007
Some Background • Climate may be described in terms of ‘Forcing’ • and ‘feedback’ processes. • Forcing processes(External processes which impose a • change of climate balance): • greenhouse gas changes; • solar variations; • volcanic eruptions. • Feedback processes(Internal processes which respond to • a forced change): • water vapour feedback; • cloud feedback; • land surface feedback; • ice feedback; • ocean feedback. GIST May 2007
Terrestrial Energy Budget (per unit surface area) and greenhouse forcing Input SW Power Pin = ITS (1 – A) / 4 = S (1 – A) Output LW Power Pout = TE4 = (1 – g)TS4 Power deposited/lost = p G = greenhouse radiative forcing (in Wm-2) = (TS4- TE4) g = normalised greenhouse effect, g = G / (TS4 ) G / 390 0.40 A = planetary albedo 0.31 = Stefan-Boltzmann constant = 5.6696 10-8 Wm-2K-4 TE= effective temperature of Earth / atmosphere 254K TS= mean surface temperature of Earth 288K Pin = Pout + p How big is p = FN = Pin – Pout? Does it vary with time? Can volcanic eruption help? 1 Wm-2 (Hansen et al., Science, 2005) 235 Wm-2(ITS 1366 Wm-2) Pin - Pout = p = FN GIST May 2007
Terrestrial Energy Budget: feedbacks and volcanic forcing hydrological cycle, circulation patterns, cloud cover & type Direct decrease in A (and smaller increase in g) due to volcano delayed responses LW SW S (1 – A) = (1 – g)TS4 + p1 + p2 + … Volcanic eruption forces a direct effect on A, and a response in g on scale of days to years greenhouse forcing Delay due to feedback processes: eg. deep ocean warming In this experiment, we use Pinatubo to “ping” the system, and we watch how the system responds GIST May 2007
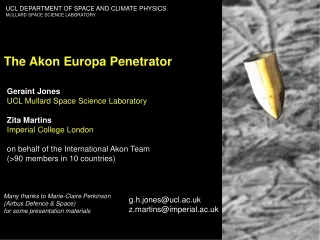
Pinatubo: A natural perturbation to the system Pinatubo (Phillipines, June 12 1991) was powerful (20 Mt), and directed vertically: so, a large mass of injecta quickly reached the stratosphere. Tropospheric material was quickly washed out. Stratospheric zonal circulation is strong, and particles quickly circulated equatorial zone, spreading N and S more slowly. Decay from stratosphere slow. GIST May 2007 http://en.wikipedia.org/wiki/Mount_Pinatubo
Pinatubo: A natural perturbation to the system Pinatubo (Phillipines, June 12 1991) was powerful (20 Mt), and directed vertically: so, a large mass of injecta quickly reached the stratosphere. Tropospheric material was quickly washed out. Stratospheric zonal circulation is strong, and particles quickly circulated equatorial zone, spreading N and S more slowly. Decay from stratosphere slow. GIST May 2007
Some Context: Recent work in USA has attempted to make measurements of stability of TOA radiation balance, and of evidence for “stored energy”, p, by measuring net flux anomaly at TOA….. p = FN NetFlux, FN Mt. Pinatubo, June 1991 20N -20S: Wielicki et al, (2001): revision in press GIST May 2007
Combination of ERBE and CERES data (Wong et al 2005; Loeb et al, 2006) GIST May 2007
FN (stored energy) Pinatubo (lost energy) …and to model it (Hansen, 2005) GIST May 2007
Following work on Pinatubo by Soden et al. [2002], we have used the perturbation caused by Pinatubo to study some of the process time constants in the system; • We have analysed the time series of the parameters shown in next Figure, and measured the (assumed exponential) rise and decay of the perturbation in each parameter; • Results produce characteristic time constants for certain processes, which ought to be captured by models. GIST May 2007
Figure 1. • The time series of the anomalies of the following parameters [adapted from Soden et al., 2002]: • (top to bottom) • observed longwave and shortwave TOA • fluxes for latitudes 60N–60S and for 1991–1996**; • Observed net flux formed from the difference between absorbed SW and emitted LW fluxes; • Observed total column water vapour and lower tropospheric temperature for 90N–90S; (NVAP project; Randel et al., 1996). • Observed 6.7 mm brightness temperature for 90N–90S (TOVS Radiances Pathfinder project: Bates et al., 1996). SW and LW flux anomalies Net flux anomalies (“stored energy”) Water vapour column and T T6.7 GIST May 2007
Concluding remarks: • Pinatubo offers a natural perturbation to the climate system; • FN –vefor volcanic eruption: +ve for stored energy; • Processes which can respond immediately to the “instantaneous” insertion of aerosol from the volcano show very short time constants (few months), driven by the time taken for aerosols to become distributed; • Processes which involve slower dynamical processes, eg moving water vapour around, take much longer (1-2 years); • Rise and decay process time constants differ; • Models ought to reproduce these relaxation times as validation. GIST May 2007
End GIST May 2007
Some of the evidence for climate change, and the uncertainties GIST May 2007
The temperature signal at the surface and the coincident changes in CO2 , CH4 , sulphates, etc… GIST May 2007
CERES (polar orbiter) monthly averages : SW LW GIST May 2007
Do we have evidence of “climate forcing” by increasing greenhouse gases? Yes! Harries et al., Nature, March 15 2001 GIST May 2007
There are, of course, uncertainties in many forcing processes….. IPCC GIST May 2007
But the major uncertainties are in feedbacks, not the forcings: Should we believe that we understand “climate change” well enough to predict our future? No! Climate change runs by different models for same conditions The feedback processes, especially clouds, water vapour, oceans, cause large uncertainty GIST May 2007
Shortwave Longwave Albedo 1/3 Terrestrial Energy Budget GIST May 2007
Variability and complexity in climate GIST May 2007
Climate is highly variable: • + Many processes are non-linear; • + Some processes are chaotic; • + Natural variability in climate components; • + Feedback processes cause variability. • Climate is very complex: • + Many greenhouse absorbers (CO2, CH4, H2O, • FCC, O3, clouds..); • + Many SW scatterers (clouds, aerosols, dust); • + Both Forcing and Feedback processes; • + Wide range of time and space scales are significant; • Variability is in spectral, spatial and temporal space. Studies of the Physics of the Earth’s Climate Balance, and the new Geostationary Earth Radiation Budget experiment (GERB) Professor John Harries Head, Space and Atmospheric Physics GIST May 2007