Download
1 / 28
280 likes | 471 Views
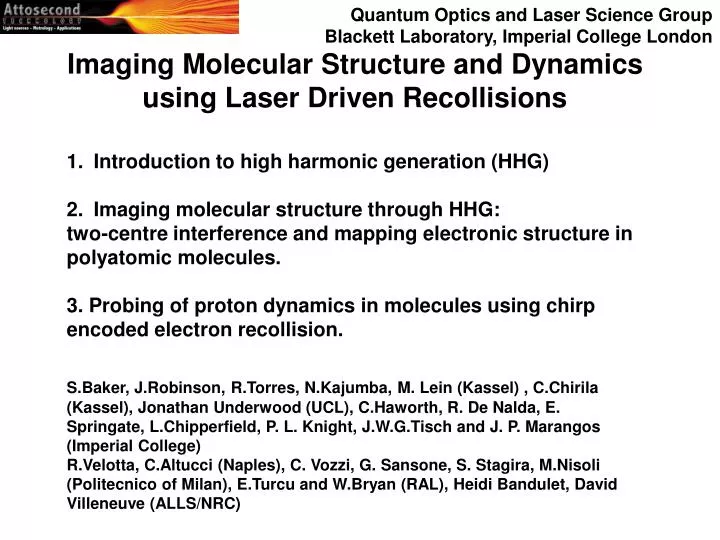
Quantum Optics and Laser Science Group Blackett Laboratory, Imperial College London. Imaging Molecular Structure and Dynamics using Laser Driven Recollisions. Introduction to high harmonic generation (HHG) Imaging molecular structure through HHG:

E N D
Quantum Optics and Laser Science Group Blackett Laboratory, Imperial College London Imaging Molecular Structure and Dynamics using Laser Driven Recollisions • Introduction to high harmonic generation (HHG) • Imaging molecular structure through HHG: • two-centre interference and mapping electronic structure in • polyatomic molecules. • 3. Probing of proton dynamics in molecules using chirp • encoded electron recollision. S.Baker, J.Robinson,R.Torres,N.Kajumba,M. Lein (Kassel) , C.Chirila (Kassel), Jonathan Underwood (UCL), C.Haworth, R. De Nalda, E. Springate, L.Chipperfield, P. L. Knight, J.W.G.Tisch and J. P. Marangos (Imperial College) R.Velotta, C.Altucci (Naples), C. Vozzi, G. Sansone, S. Stagira, M.Nisoli (Politecnico of Milan), E.Turcu and W.Bryan (RAL), Heidi Bandulet, David Villeneuve (ALLS/NRC)
hXUV picks up K.E. High harmonic generation occurs on a sub-optical cycle timescale Recollisional model of HHG: e.g. Corkum PRL (1993), Lewenstein et al (1994) Tunnel ionisation Acceleration in the laser field Recombination to ground state Bound electron HHG signal arises from coherent addition of contributions from atoms/molecules in the sample. For these contributions to add constructively initial and final states must be the same, giving the process a unique specificity.
Range of return energies, and also emission times Harmonic emission is therefore chirped Y. Mairesse et al., Science, 302, 1540 (2003). Each order of harmonic is emitted at a different time Temporal chirp of harmonic spectrum Ionisation can occur for a range of times around the peak of the electric field. Parts of the electron wavepacket born at different times follow different trajectories, and gain varying amounts of energy from the field. Laser electric field Time
Temporal chirp of electron wavepacket long trajectories short trajectories Harmonic cut-off
Harmonic Dipole Amplitude and Phase Depends upon Molecular Alignment E Harmonic dipole phase and amplitude calculated by numerical treatment with TDSE for harmonic in H2+ as a function of orientation for 31st harmonic Two centre interference is shown to be responsible for dip and phase modulation (Lein et al, PRL 88-183903 (2002) and PRA 66-023805 (2002)) Experimental evidence for anisotropic dipole phase from earlier experiments of HHG in adiabatically aligned CS2 (Velotta et al, PRL 87-183901 (2001))
The dipole amplitude is determined by the relative phase of the recolliding electron wave at the two centres. PRA 66-023805 (2002) This process has recently been observed in HHG from CO2 in the group of Hirofumi Sakai (Tokyo) Nature 435, 470 (2005)
The HHG process can be transparently formulated in the strong field approximation electron wavelength Laser driven returning electron: plane wave Tunnel ionized electron molecule (e.g.CO2) Amplitude of HHG process determined by (c.f Lewenstein et al 1994) : Tunnel ionization from the molecular bound-state; Propagation in the laser field; Recombination back into molecular bound-state. The last factor plays a critical role in new methods to use HHG to image molecular structure in aligned molecular samples e.g. Tomographic reconstruction (Itatani et al Nature (2004)) or recombination step interference signatures studied by our group (Lein et al PRL (2002), Vozzi et al PRL (2005)) and Kanai et al Nature (2005).
Fixing molecules in space: Non-adiabatic alignment q E S |y> = CJ e-iBJ(J+1)t |J M> J The relative phases among the different rotational states determine the molecular alignment. Intense ultrashort (t < Trot) laser field (I0 > 1012 W/cm2) and coherent excitation of rotational levels. a|| Polarizability anisotropy: Da = a|| - a a H = B J2 - 1/4 E2 (Da cos2q + a) |J M>in
Non-adiabatic alignment of molecules allows molecular structure to be extracted from HHG measurements Prompt alignment Full revival E Trot = (2Bc)-1 <cos2q> > 1/3 Alignment <cos2q> < 1/3 Anti-alignment
At the peak of the rotational revival a robust minimum is observed in the HHG due to the destructive interference between 2-centres Our work goes further than that of Sakai in that we have measured HHG to significantly higher recollision momenta (up to 49th rather than 31st harmonic) Published in Physical Review Letters 95 153902 (2005)
Can HHG from polyatomic molecules be mapped to electronic structure via SFA? We have investigated HHG from a series of aligned organic molecules: acetylene, ethylene, allene, at ASTRA CLF-RAL Q E HH driving field ~ 35 fs, 16 mJ E Aligning field Aligning beam: 90 fs, 200 mJ, 2x10¹³ W/cm2 HH driving beam: 14 fs, 300 mJ, 1.8x10¹⁴ W/cm2
HHG in Aligned Organic Molecules • Observe HHG spectra in small organic molecules with a p-bonding HOMO structure. • Measure HHG spectra as a function of alignment. • Seek signatures of the molecular structure through the HHG spectra. Extend the methods of ultra-fast molecular imaging to more complex systems.
Ethylene (CH2=CH2) - Planar – Asymmetric top - Double bond - IP = 10.5 eV Allene (CH2=C=CH2) - Non linear – Symmetric top - Two double bonds - IP = 9.7 eV The molecules: Acetylene (CHCH) - Linear – Symmetric top - Triple bond - IP = 11.4 eV
Z Z Molecular orbital is a LC of atomic orbitals of gaussian type: Z’n Zn g Y’n Y Y b X’n a X X Calculations use the SFA (Lewenstein model):
Summary of aligned organic molecule HHG studies • The measurements of HH emission as a function of the alignment angle show a behaviour which is characteristic of the bonding p structure in the HOMO orbital of the molecules. Extra features are observed in Allene. • A calculation using SFA reproduces the general features. The angular distribution of the aligned sample must be taken into account in order to compare the calculations quantitatively with the experimental results. • HHG from aligned organic molecules is directly related to electronic structure through the SFA. Torres et al Physical Review Letters 98, 203007 (2007)
HHG from moleculescan also be used to see fast nuclear dynamics in the molecular ion
For the short trajectories selected in this experiment there is a well defined time to frequency encoding during the 0.6-1.6fs recollision interval Chirp Encoded Electron Recollisions
Exploiting the temporal chirp of an harmonic spectrum Lein showed [Phys. Rev. Lett., 94, 053004 (2005).] that harmonic signal includes contribution from nuclear part of wavefunction: Dipole moment responsible for HHG given by where C(t) is the “nuclear correlation function” Wavefunction describing nuclear wavepacket
Exploiting the temporal chirp of an harmonic spectrum • 2 predictions: • Stronger harmonic signal in a heavy isotope • Ratio between signals D2:H2 increases with harmonic order Phys. Rev. Lett., 94, 053004 (2005) Strong order-to-order variation due to interference between short and long trajectories.
This measurement uses our high intensity few-cycle laser system to drive HHG in the molecules Requires short (<~10fs) pulses to avoid “disturbance” of molecule prior to ionisation. In particular ionization occurs only in the few-cycles ~2x10¹⁴ Wcm-2. 1 kHz, 7-8 fs, 0.25 mJ.
Experimental approach Focus 9 mm before jet to isolate short trajectories. Intensity delivered at interaction region: 2 x 10¹⁴ Wcm-2: shot-to-shot fluctuation <3%, monitored between data runs. Apply correct gas jet backing pressures to ensure equal gas densities at the interaction region. 2 Hz pulsed valve Microchannel Plate Imaging Detector Off-Axis Parabolic Mirror Soft X-ray “Flat-Field” Grating
Experiment Confirms These Predictions Calculated value of ratio from C()
And the proton dynamics can be reconstructed from the H2/D2 ratio The nuclear motion reconstructed from the experimental data by multiple runs of a genetic algorithm (red curves) converges closely to the exact result (blue curves) calculated using the exact Born-Oppenheimer potentials for H2+ and D2+. This method has determined <R(t)> with ~100 attosecond / 0.1 Angstrom resolution Probing Attosecond Dynamics with Chirp Encoded Recollisions PACER
ultrafast structural rearrangement of cation + CH CH 4 4 tetrahedral C n 2 The nuclear correlation function ratio between CH4 and CD4 provides the first evidence of an ultra-fast rearrangement of methane upon ionisation Baker et al Science 312, 424 (2006)
Recent measurements with 30fs pulses have shown intensity dependence in the data consistent with alignment and transient 2-centre interference intensity ~3 x 10¹⁴Wcm-2 intensity < 2 x 10¹⁴ Wcm-2
Conclusions and further work • Molecular structure is revealed through systematic measurements of HHG in aligned molecules • Proton dynamics can be imaged using inherent chirp within the harmonic emission process • Measurements to track proton dynamics over a longer timescale are possible using longer wavelengths • This technique is applicable in principle to measurement of electronic dynamics also.