Download

1 / 24
240 likes | 355 Views
Registration-based studies of atrophy in ADNI. Josephine Barnes on behalf of the Dementia Research Centre UCL Institute of Neurology, London, UK. Boundary Shift Integral. intensity. B. I GM. I base (x). A. I CSF. A. x. Intensity change from A to B. B. Baseline scan.

E N D
Registration-based studies of atrophy in ADNI Josephine Barnes on behalf of the Dementia Research Centre UCL Institute of Neurology, London, UK
Boundary Shift Integral intensity B IGM Ibase(x) A ICSF A x Intensity change from A to B B Baseline scan
Boundary Shift Integral intensity B IGM Ireg(x) A ICSF A x Intensity change from A to B B Registered repeat scan
Whole brain and ventricular measures Evans et al. European Radiology 2010
MCI decline to AD Evans et al. European Radiology 2010
Automatic intensity window selection intensity IGM 1 GM SD I1 i I2 1 WM SD ICSF x Leung et al. Neuroimage 2010
Manufacturer-specific results Leung et al. Neuroimage 2010
Sample sizes Leung et al. Neuroimage 2010
Phantom scanning BASELINE REPEAT
Phantom correction Clarkson et al. Neuroimage 2009
Phantom correction • 9 degrees of freedom registration is equivalent to phantom correction • occasionally registration can detect when there are problems with the phantom • registration-based scaling correction does not require extra scanning time Clarkson et al. Neuroimage 2009
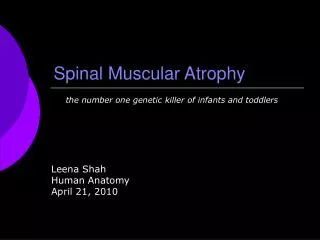
In “mild” AD the hippocampus is10-20% smaller than in controls Hippocampal atrophy Seab ’88, De Leon ’89, Scheltens ’92, Soininen ’94, Jack ’99, Du ’01, Killiany ’02 Seab ’88, De Leon ’89, Scheltens ’92, Soininen ’94, Jack ’99, Du ’01, Killiany ’02
2. Top eight matches propagated and fused to produce automated hippocampal segmentation 1. Best matches between new subject and library measured by R2 Hippocampal MAPS Leung et al. Neuroimage 2010, Barnes et al. poster IC-P-63
Baseline diagnosis Leung et al. Neuroimage 2010, Barnes et al. poster IC-P-63
Diagnostic follow-up ** ** ** ** * * p=0.01, **p</=0.005 Barnes et al. poster IC-P-63
Sample size estimates (80% power, 5% type 1 error rate) for a 25% reduction in mean AD-0 difference AD-C difference MCI-0 difference MCI-C difference Schott et al. Neurobiol Aging 2010, Barnes Oral Presentation (Tue – O3 -06)
Covariate adjustment: % reductions in sample size in ADsubjects Schott et al. Neurobiol Aging 2010, Barnes Oral Presentation (Tue – O3 -06)
MCI Schott et al. Neurobiol Aging 2010, Barnes Oral Presentation (Tue – O3 -06)
AD > C TBM (longitudinal) MCI > C AD > MCI
Covariate effects APOE 4 carriers = greater losses Lower age = higher rates
Thanks Dementia Research Centre, Alzheimer’s Research Trust, Alzheimer’s Association