Download
1 / 20
370 likes | 644 Views
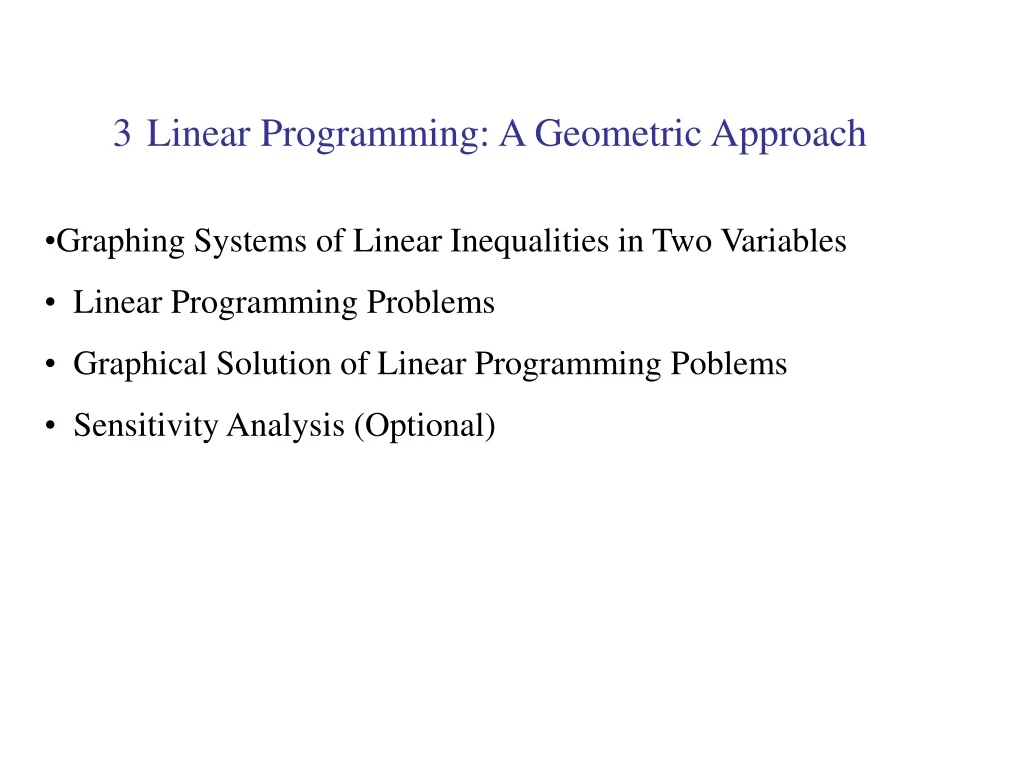
3. Linear Programming: A Geometric Approach. Graphing Systems of Linear Inequalities in Two Variables Linear Programming Problems Graphical Solution of Linear Programming Poblems Sensitivity Analysis (Optional). 3.1 Graphing Linear Inequalities.

E N D
3 Linear Programming: A Geometric Approach • Graphing Systems of Linear Inequalities in Two Variables • Linear Programming Problems • Graphical Solution of Linear Programming Poblems • Sensitivity Analysis (Optional)
3.1 Graphing Linear Inequalities A linear equation in two variable x and y ax+by+c=0, where a,b not both equal to zero, has a solution set that may be exhibited graphically as points on a straight line in the xy-plane. We now show that there is also a simple graphical representation For linear inequalities in two variables.
Graphing Linear Inequalities Example. Graph Notice that the line (=) is part of the solution y x Also, any point in the lower half-plane satisfies the inequality so this region is shaded.
Graphing Linear Inequalities The line (=) is not part of the solution so it is dashed. Example. Graph y x Any point in the lower half-plane satisfies the inequality.
Procedure for Graphing Linear Inequalities • Draw the graph of the equation obtained by replacing the inequality symbol with an equal sign. Make the line dashed if the inequality symbol is < or >, otherwise make it solid. • Pick a test point in one of the half planes, substitute the x and y values into the inequality (use the origin whenever possible). • If the inequality is satisfied, shade the half plane containing the test point otherwise shade the other half plane.
Example. Graph Dashed since < y Test (0,0): 3(0)+2(0) < 6 x True so shade region containing (0,0)
Example. Graph Example. Graph y y x x
Example. Graph the solution set for the system: y x Points must satisfy both inequalities (overlap of individual shaded regions)
Unbounded Region Bounded Region y y x x
3.2 Linear Programming Problem A linear programming problem consists of a linear objective function to be maximized or minimized, subject to certain constraints in the form of linear equalities or inequalities.
Ex. A small company consisting of two carpenters and a finisher produces and sells two types of tables: type A and type B. Each type-A table will result in a profit of $50, and each type-B table will result in a profit of $54. A type-A table requires 3 hours of carpentry and 1 hour of finishing. A type-B table requires 2 hours of carpentry and 2 hours of finishing. Each day there are 16 hours available for carpentry and 8 hours available for finishing. How many tables of each type should be made each day to maximize profit? (Formulate but do not solve the linear programming problem.)
Organize the Information: Let x = # type A and y= # type B. The objective function to be maximized is given by: P = 50x + 54y . . .
The constraints are given by: Carpentry Finishing Also the number of units is nonnegative: So we have:
3.3 Theorem: Linear Programming If a linear programming problem has a solution, then it must occur at a vertex, or corner point, of the feasible set associated with the problem. If the objective function is optimized at two adjacent vertices of the feasible set, then it is optimized at every point on the line segment joining these vertices (hence infinitely many solutions).
The Method of Corners • Graph the feasible set. • Find the coordinates of all corner points (vertices) of the feasible set. • Evaluate the objective function at each corner point. • Find the maximum (minimum). If there is only one, it is unique. If two adjacent vertices share this value, there are infinitely many solutions given by the points on the line segment connecting these vertices.
Graphical Method (2 variables) Maximize P = 4x + 5y Optimal solution (if it exists) will occur at a corner point Subject to Check Vertices: y Feasible set – candidates for a solution The maximum is 25 at (5, 1) x
Example. Minimize C = 10x + 11y Subject to y Check Vertices: Feasible set The minimum is 205 at (15, 5). x
Example A toy manufacturer makes bikes, for a profit of $4, and wagons, for a profit of $5. To produce a bike requires 3 hours of machine time and 4 hours of painting time. To produce a wagon requires 5 hours machine time and 4 hours of painting time. There are 20 hours of machine time and 24 hours of painting time available per day. How many of each toy should be produced to maximize the profit?
Solution Let x = the number of bikes produced Let y = the number of wagons produced The linear programming problem is . . .
Solution (cont.) Sketch the graph of the feasible set to locate all of the corner points. y Check Vertices: Feasible set – candidates for a solution x In order to produce the maximum profit $25, the toy manufacturer needs to make 5 bikes and 1 wagon.