Download

1 / 34
340 likes | 492 Views
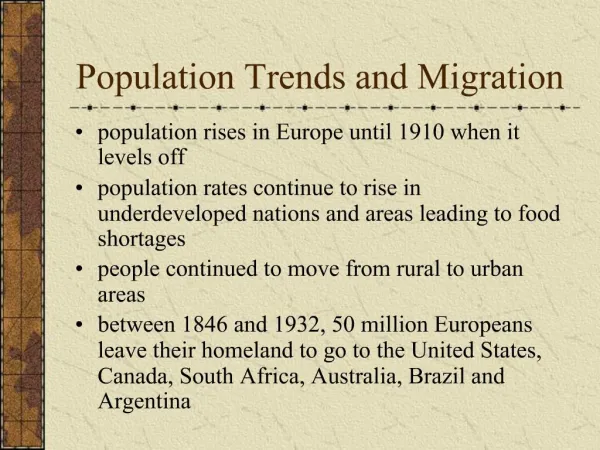
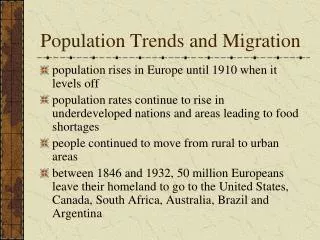
Wisconsin Population Trends. Patrick J. Farley Wisconsin Department of Administration Division of Intergovernmental Relations. Wisconsin Population Census 1990 and 2000. 1990 2000 Change Residents: 4,891,769 5,363,675 471,906 Median Age: 32.9 36.0 3.1

E N D
Wisconsin Population Trends Patrick J. Farley Wisconsin Department of Administration Division of Intergovernmental Relations
Wisconsin PopulationCensus 1990 and 2000 19902000Change Residents: 4,891,769 5,363,675 471,906 Median Age: 32.9 36.0 3.1 Households: 1,822,118 2,084,544 262,426 Household Size: 2.61 2.50 (.11)
US Population GrowthCensus 1990 to 2000 United States: 13.15% Wisconsin: 9.65% >20% 10-20% 7-10% 0-7%
Congressional Power Shifts to the South and West...2000 Change in House Seats 2 Seat Gain 1 Seat Gain
…from the Midwest and NortheastCensus 2000 Change in House Seats 2 Seat Gain 1 Seat Gain 1 Seat Loss 2 Seat Loss
Seats in the House of Representatives Wisconsin California Arizona
Wisconsin County PopulationCensus 2000 500,000 and over 250,000-499,999 50,000-249,999 Fewer than 50,000
Wisconsin County PopulationCensus 2000 4-Year UW Campus 2-Year UW Campus 500,000 and over 250,000-499,999 50,000-249,999 Fewer than 50,000
Wisconsin and Surrounding Metro PopulationCensus 2000 4-Year UW Campus 2-Year UW Campus 500,000 and over 250,000-499,999 50,000-249,999 Fewer than 50,000
Wisconsin and Surrounding Metro PopulationCensus 2000 Wisconsin 5,363,704 32% Chicago & Rockford Metro 8,747,837 52% Twin Cities Metro 2,868,847 17% Total 16,980,388
Wisconsin and Surrounding Metro PopulationCensus 2000 Wisconsin 5,363,704 32% Chicago & Rockford Metro 8,747,837 52% Twin Cities Metro 2,868,847 17% Total 16,980,388 Florida 15,982,378 New York 18,976,457
Dane CountyNationwide Migration 1995-2000 To DaneFrom DaneNet 85,273 (76,903) 8,370
Dane CountyTop Ten County to County In-Migration 1995-2000 1. Milwaukee County, Wisconsin 4,858 2. 3. Waukesha County, Wisconsin 3,026 4. Rock County, Wisconsin 2,425 5. Columbia County, Wisconsin 2,266 6. Jefferson County, Wisconsin 2,006 7. Sauk County, Wisconsin 1,967 8. Brown County, Wisconsin 1,923 9. 10. Grant County, Wisconsin 1,339
Dane CountyTop Ten County to County In-Migration 1995-2000 1. Milwaukee County, Wisconsin 4,858 2. Cook County, Illinois 4,243 3. Waukesha County, Wisconsin 3,026 4. Rock County, Wisconsin 2,425 5. Columbia County, Wisconsin 2,266 6. Jefferson County, Wisconsin 2,006 7. Sauk County, Wisconsin 1,967 8. Brown County, Wisconsin 1,923 9. Hennepin County, Minnesota 1,883 10. Grant County, Wisconsin 1,339
Dane CountyTwin Cities and Northern Illinois Migration 1995-2000 To DaneFrom DaneNet Northern Illinois 7,583 (5,469) 2,114 Twin Cities 3,721 (3,792) (71)
Milwaukee CountyNationwide Migration 1995-2000 To From Net MilwaukeeMilwaukee 101,758 (149,723) (47,965)
Milwaukee CountyTop Ten County to County In-Migration 1995-2000 1. Waukesha County, Wisconsin 14,987 2. Cook County, Illinois 9,034 3. Racine County, Wisconsin 4,484 4. Dane County, Wisconsin 3,855 5. Washington County, Wisconsin 2,762 6. Ozaukee County, Wisconsin 2,706 7. Brown County, Wisconsin 2,094 8. Kenosha County, Wisconsin 1,664 9. Dodge County, Wisconsin 1,616 10. Los Angeles County, California 1,593
Milwaukee CountyTwin Cities and Northern Illinois Migration 1995-2000 To From Net MilwaukeeMilwaukee Northern Illinois 12,580 (7,229) 5,351 Twin Cities 2,148 (3,720) (1,572)
Kenosha CountyNationwide Migration 1995-2000 To From Net KenoshaKenosha 26,393 (22,479) 3,914
Kenosha CountyTop Ten County to County In-Migration 1995-2000 1. Lake County, Illinois 6,010 2. Cook County, Illinois 3,340 3. Racine County, Wisconsin 2,332 4. Milwaukee County, Wisconsin 1,261 5. McHenry County, Illinois 662 6. DuPage County, Illinois 469 7. Dane County, Wisconsin 385 8. Waukesha County, Wisconsin 359 9. Walworth County, Wisconsin 340 10. San Diego County, California 269
St. Croix CountyMigration 1995-2000 To From Net St. CroixSt. Croix 13,745 (10,095) 3,650
St. Croix CountyCounty to County In-Migration 1995-2000 1. Washington County, Minnesota 1,639 2. Ramsey County, Minnesota 1,313 3. Pierce County, Wisconsin 1,218 4. Hennepin County, Minnesota 908 5. Dakota County, Minnesota 774 6. Polk County, Wisconsin 573 7. Dunn County, Wisconsin 554 8. Eau Claire County, Wisconsin 371 9. Rusk County, Wisconsin 282 10. Anoka County, Minnesota 247
Wisconsin Population Actual Projected
Projected Population Growth2000-2015 20% and greater 10% to 20% 0% to 10% Population Loss
Projected Population Growth2000-2015 20% and greater 10% to 20% 0% to 10% Population Loss
Concluding Points • Wisconsin's share of the U.S. population will decline. • West Central counties, Dane County, the Fox Valley and southeastern counties will lead Wisconsin’s growth over the next 30 years. • Northern Illinois and the Twin Cities provide growth opportunities for Wisconsin.
Concluding Points • The elderly population will increase dramatically as the Baby Boom generation enters retirement age. • Wisconsin’s changing demographics present challenges and opportunities for educators and public policy makers.
Bibliography • U.S. Bureau of the Census. 1991. "1990 Census of Population and Housing: Summary Population and Housing Characteristics". • U.S. Bureau of the Census. 2001. "2000 Summary File 1- 100 Percent Data" • Minnesota Planning- State Demographic Center. 2003. "Minnesota Population Projections 2000-2030." • Illinois Department of Commerce and Economic Opportunity. 1997. "Population Projections for the State and Counties of Illinois, 1990 to 2020." • Wisconsin Department of Administration. 2002. "Wisconsin Population Projections: 2000-2030."
Wisconsin Population Trends Patrick J. Farley (608) 267-6902 patrick.farley@doa.state.wi.us