Download
1 / 11
110 likes | 171 Views
I-SS Lead Teacher Presentation Dr. Setser 1/25/07. What Do the Data Say?. “Demystifying and Depersonalizing Data”. The difference between personal and professional feedback. A funny thing happened on the way to lunch yesterday….. Comparative Data from my wife

E N D
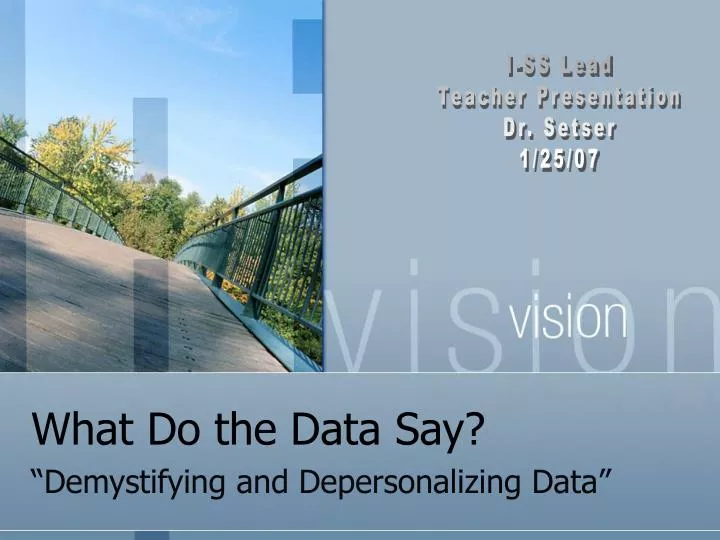
I-SS Lead Teacher Presentation Dr. Setser 1/25/07 What Do the Data Say? “Demystifying and Depersonalizing Data”
The difference between personal and professional feedback • A funny thing happened on the way to lunch yesterday….. • Comparative Data from my wife • It’s all about getting better • PDSA information • http://www.clooneystudio.com/
Comparative Data Analysis Deployment Steps -Better lighting -Exercise -Personal Chef -Make up artist -Plastic Surgery
Qualitative Survey Data • A Plus, a Delta, and the Cloak of Anonymity – Why do people make comments? • Charting themes and perceptions of feedback (The 5 or more rule) • The depth of people’s perceptions • The stories we tell ourselves (Crucial Conversations)
Interpreting Model Survey Results • Qualitative ratings are compiled by using a plus, minus score card to indicate approval, disapproval, or mixed reactions. Therefore, these averages do not equate to cumulative ratings, but do provide the opportunity to evaluate key threads and perceptions.
2006 Data Analysis • 405 qualitative survey comments made • 236 comments were positive towards the model - 58% • 28 did not know or could not comment on the model - 7% • 141 had delta or negative oriented comments - 35%
Samples Continued • 65% of the elementary schools favor the model • 15% had mixed opinions or split opinions on the model • 5% could not respond due to not having model support (LT) • 15% had a negative or delta overall opinion of the model at this level
Samples Continued • 71% favor the model • 29% have a delta or negative oriented opinion on qualitative surveys • 60% favor the model • 40% have a delta or negative oriented opinion on qualitative surveys
And the Survey Says • "An extremely useful step in leadership development is seeing myself as others see me. So I need to understand their perceptions of my behavior. My effectiveness in leading, relating to, or working with others is highly dependent on their perceptions of me." from Jim Clemmer's article, "Feedback to See How Others See Me"
The Road Ahead • Where you are on the continuum of model deployment effects your results – 1st year lead teacher, 2nd year deployment, 1st year of increased expectations, etc. • Change the perception, change the culture • Here’s to The Crazy Ones – Apple Gift for Lead Teachers