Download
1 / 10
100 likes | 228 Views
Using Software to Code Facial Expressions of Emotion. Kristin Smith-Crowe | University of Utah Jaime M. I. Potter and Sigal G. Barsade | University of Pennsylvania Technical Assistance: Robert Botto , Programmer/Analyst, Senior IT Project Leader. Background on Study .

E N D
2014 Academy of Management Conference | Unobtrusive Measures Professional Development Workshop Using Software to Code Facial Expressions of Emotion Kristin Smith-Crowe | University of Utah Jaime M. I. Potter and Sigal G. Barsade | University of Pennsylvania Technical Assistance:Robert Botto, Programmer/Analyst, Senior IT Project Leader
Background on Study • We are conducting research on emotional contagion. • We video recorded participants’ faces while they watched a video stimulus. • The study took place in a computer lab equipped with desktop computers. • Participants were recorded via a webcam. • The video stimulus was embedded in a Qualtrics survey. • The audio was delivered via headphones. 2014 Academy of Management Conference | Unobtrusive Measures Professional Development Workshop
Alignment An important issue was the alignment of the start of the video stimulus with the start of the recording of participants. We needed to know exactly when the participant saw what so that we could test hypotheses about the reactions of participants to particular content. We hoped to find a way to automate the simultaneous start of both, but we weren’t able to do so. Instead, we found a low-fi solution that entailed collecting the data in such a way as to allow us to manage the alignment post data collection. 2014 Academy of Management Conference | Unobtrusive Measures Professional Development Workshop
Alignment • During the Data Collection • We inserted a page in our Qualtrics survey telling participants to raise their hands to call over an RA. • The RA then began a screen capture program, the webcam, and then the video stimulus. • We used Free Screen to Video V 2.0 to create a video of the computer screen. This allowed us to record when the video recording of the participant began and when the video stimulus began. • Post Data Collection • For each participant, we watched the screen capture videos in Aegisub to mark the times that the video stimulus began and the video recording of the participant began. • The precision of the timer in Ageisub allowed for greater precision in alignment. 2014 Academy of Management Conference | Unobtrusive Measures Professional Development Workshop
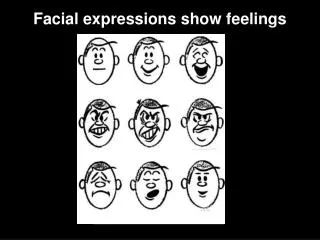
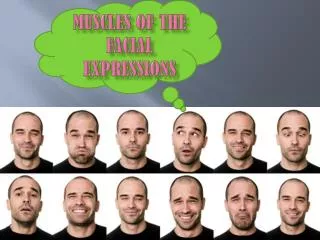
Analysis of Emotion Data • Once alignment was achieved, we used NoldusFaceReader 5 to analyze participants’ facial expressions. • This software can analyze live feeds or videos. • It detects the type and intensity of seven categories of expressions. • Happy, sad, angry, surprised, scared, disgusted, and neutral • Click on the pictures below to see examples of FaceReader analyses: 2014 Academy of Management Conference | Unobtrusive Measures Professional Development Workshop
Output Files An example of the output appears below. FaceReader produces one text file per participant. Setting FaceReader to analyze 30 frames per second produces a lot of data. In this case, there are 720 rows of data per participant. 2014 Academy of Management Conference | Unobtrusive Measures Professional Development Workshop Note: These data are fictional.
Output Files Converted to Excel Once we had all of the output files, we merged them into an Excel file. Each row is a point in time and the numbers (e.g., Neutral1) refer to a participant (e.g., Participant 1). We are using the Excel file to figure out how to aggregate the data as we have 5,040 data points per participant. 2014 Academy of Management Conference | Unobtrusive Measures Professional Development Workshop Note: These data are fictional.
Output Files Converted to SPSS Once we aggregate the data, we will create an SPSS file that will look something like this (where T1 = time 1 and so forth). This type of format will allow us to test our hypotheses. 2014 Academy of Management Conference | Unobtrusive Measures Professional Development Workshop Note: These data are fictional.
Tips • Collect race and age data. • The general model does not work as well for East Asian people, the elderly, and children. There are models that are particular to these populations. • If you have such data, you can make sure that you aren’t seeing systematic missing data due to race and age. • FaceReader 6 is now available. • It features an improved East Asian model; the capacity to detect contempt; and the capacity to analyze expressions based on the circumplex model of affect. 2014 Academy of Management Conference | Unobtrusive Measures Professional Development Workshop
Technology Used 2014 Academy of Management Conference | Unobtrusive Measures Professional Development Workshop Note: We also used Excel and SPSS.