Download
1 / 31
320 likes | 454 Views
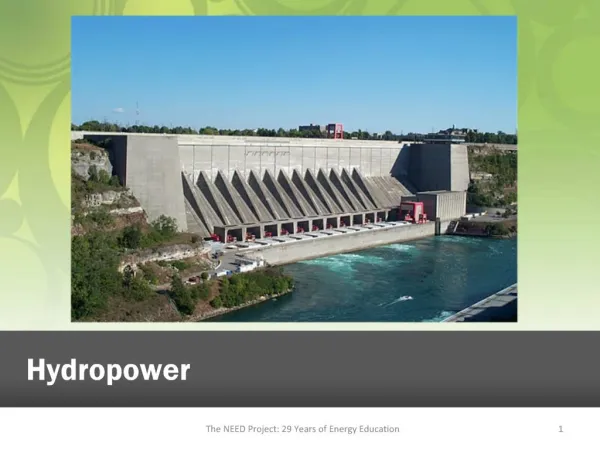
Hydropower energy. Historical Growth of Hydroelectric power:. Currently Hydro power is 7% of the total US Energy Budget. This has been going decreasing with time This varies considerably with region in the US due to the availability of freely flowing streams

E N D
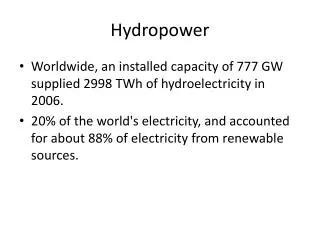
Historical Growth of Hydroelectric power: • Currently Hydro power is 7% of the total US Energy Budget. This has been going decreasing with time • This varies considerably with region in the US due to the availability of freely flowing streams • Dam building really was initiated in the 1930's as part of a public works program to combat the depression • Low cost per kWh caused exponential increase of dam building from 1950-1970 • Since 1970 hydroproduction has leveled off and therefore becomes an increasingly smaller percentage of the US energy budget. • Hydropower is a natural renewable energy • source
Hydropower production is sensitive to secular evolution of weather; seasonal snowpacks, etc, etc. Long term droughts (10 years or so) seem to occur frequently in the West • About 30% of the hydropotential in the US has been tapped to date • Why is Hydro so attractive? • BECAUSE ITS CHEAP! for the consumer average price is around 4 cents per kWh - this is 3 times less than the national average! • Low cost to the consumer reflect relatively low operating costs of the Hydro Facility. Most of the cost is in building the dam • Operating costs about 0.6 cents per kWh • Coal Plant averages around 2.2 cents per • kWh which reflects costs of mining, transport and • distribution.
How hydropower works? Hydrocycle: Because the water cycle is an endless, constantly recharging system, hydropower is considered a renewable energy
Energy density in stored elevated water is high one liter of water per second on a turbine generates 720 watts of power. If this power can be continuously generated for 24 hours per day for one month then the total number of kWh per month is then: 720 watts x 24 hours/day x 30 days/month = 518 kWh/month. Power generating capacity is directly proportional to the height the water falls. For example, for a fall of only 3 m, 30 times less electricity would be generated (e.g. 17 Kwh/month) - but this is just for a miniscule flow rate of 1 kg/sec.
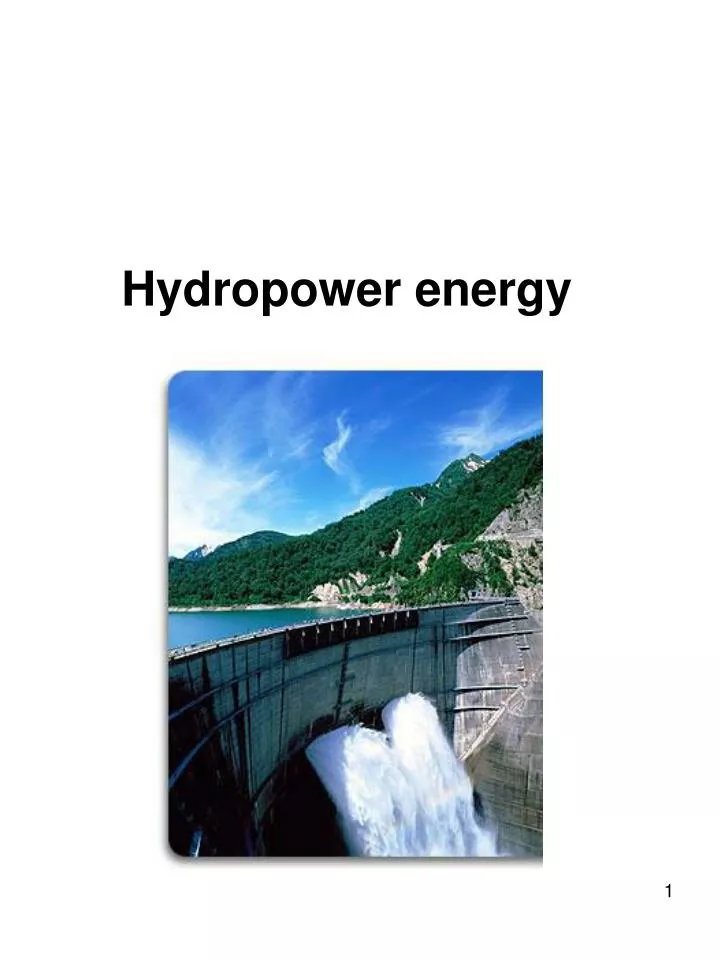
Types of Hydropower Plants • impoundment, • diversion, • pumped storage Impoundment The most common type of hydroelectric power plant is an impoundment facility. An impoundment facility, typically a large hydropower system, uses a dam to store river water in a reservoir. Water released from the reservoir flows through a turbine, spinning it, which in turn activates a generator to produce electricity. The water may be released either to meet changing electricity needs or to maintain a constant reservoir level.
Diversion A diversion, sometimes called run-of-river, facility channels a portion of a river through a canal or penstock. It may not require the use of a dam. The Tazimina project in Alaska is an example of a diversion hydropower plant. No dam was required.
Pumped Storage When the demand for electricity is low, a pumped storage facility stores energy by pumping water from a lower reservoir to an upper reservoir. During periods of high electrical demand, the water is released back to the lower reservoir to generate electricity
Sizes of Hydroelectric Power Plants Facilities range in size from large power plants that supply many consumers with electricity to small and micro plants that individuals operate for their own energy needs or to sell power to utilities. Large Hydropower – capacity of more than 30 MW Small Hydropower – capacity 100 kW – 30 MW Micro Hydropower - capacity < 100 kW .
Hydro Power – Some Facts • Big range in capacity and size • power capacity – 1 kWe to 12000 MWe • hydraulic head < 1 m to 1500 m (from low-head to high-head) • largest earth dam height – 300 m (Rogun, Tajikistan) • largest reinforced concrete dam height– 285m (Switzerland), will be in China • reservoir volume – >106 m3 (Uganda) • reservoir area – 9,600 km2(La Grande complex, Quebec) • hydraulic head – 1 m to 1500 m (S. Fiorano, Italy)
Potential for hydropower development in selected countries based on technical potential and economic potential in today’s energy markets
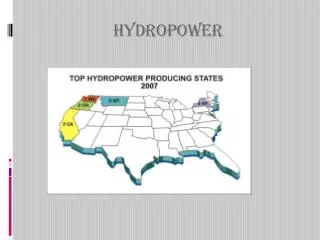
Capacities of some large dams: Grand Coulee 1942 6500 MW John Day 1969 2200 MW Niagara (NY) 1961 2000 MW The Dalles 1957 1800 MW Chief Joseph 1956 1500 MW McNary 1954 1400 MW Hoover 1936 1345 MW Glen Canyon 1964 950 MW
Impact of Catalysis on Energy and Fuel Production A Look into the Future Impact
A Few Remarks on Energy • Energy is the only world currency • Energy systems has a social impact • Refinery & Petrochemical technologies have battery limits • Social awareness of the impact on environment and health
Past, Present and Future……. Which possible futures? Scenario?????
POWER GENERATION Coal fuelled power plants: Emission: CO2, SO2, NOx, particulates SELECTIVE CATALYTIC REDUCTION OF NOX
Transportation fuels • - gasoline • Diesel fuel • jetfuel (kerosene fraction) • synthetic gasoline (Fisher-Tropsch) • synthetic Diesel (Fisher-Tropsch) • biodiesel • natural gas (NG) • SNG (synthetic natural gas) • LPG (liquified Petroleum Gas) • (mixture of propane and butane) • E85 (85% gasoline and 15% ethanol) • (fuel-flexible vehicles) • ethanol • methanol • hydrogen
Gasoline reforming is the important process of altering the composition of gasoline to achieve a higher octane rating. As shown above, gasoline is a complex mixture of hydrocarbons, generally falling in the range of C6-C10, and different mixtures have different octane ratings. In order for refineries to produce gasoline with a consistent octane rating when the composition of the crude may be highly variable, catalytic reforming is one of the final step in gasoline synthesis. Upgrading by reforming may be accomplished, in part, by an increase in volatility (reduction of molecular size) or by the conversion of n-paraffins to isoparaffins, olefins, and aromatics, and of naphthenes (cycloalkanes) to aromatics.