Download

1 / 35
350 likes | 357 Views
NYSE: WAG Junying Shen Xiaosi (Sarah) Song Chi (Tracy) Zhang Xiangyuan (Arthur) Zhong Nov 6, 2012. Agenda. Introduction Industry and Macroeconomic Overview Company Overview Relevant Stock Market Financial Analysis Financial Projections Recommendation. Current Portfolio Position.

E N D
NYSE: WAG Junying Shen Xiaosi (Sarah) Song Chi (Tracy) Zhang Xiangyuan (Arthur) Zhong Nov 6, 2012
Agenda • Introduction • Industry and Macroeconomic Overview • Company Overview • Relevant Stock Market • Financial Analysis • Financial Projections • Recommendation
Current Portfolio Position • 500 shares bought on Oct 6, 1999 @ $25.00 • Current Stock Price: $ 34.89 (Nov 2, 2012) • EPS: $ 2.24 • Unrealized Gain: 36.32%
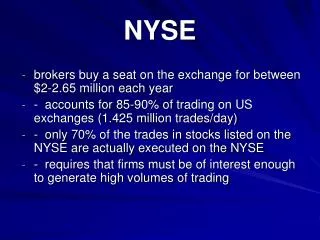
Pharmacies & Drug Stores Industry Overview • Revenue: $238.5 billion • Annual Growth Rate since 2007: 1.7% • Profit: $5.2 billion • Major players: • Walgreen 30.9% • CVS Caremark 27% • Rite Aid Corporation 11% Source: WWW.IBISWORLD.COM
Pharmacies & Drug Stores Industry Structure Source: WWW.IBISWORLD.COM
External Drivers • Per capita disposable income • Private Health Insurance Coverage • Aging Population • Medicare, Medicaid & Obamacare • Generic Drug Wave
Per Capita Disposable Income • Per Capita Disposable Income determines a person’s ability to purchase goods and services • The growth is hindered by the negative Macroeconomic outlook though
Private Health Insurance Coverage • Pros: Private health insurance membership can lower the price of pharmaceutical and hence increase the demand for the industry • Cons: Managed care organizations associated with health insurance plans can give lots of pressure on drug price and cut profitability margin
Aging Population • Baby boomers are getting old and this will bring huge opportunities for the industry because senior people has a higher demand for medical services Source: WWW.IBISWORLD.COM
Medicare, Medicaid & Obamacare • Medicare and Medicaid subsidize prescription drug purchases and can spur demand for the industry • Obamacare is aimed at increasing the insurance coverage, which may bring opportunities • But you’ll never know until tonight….
Generic Drug Wave • After the expiration of the patent of a medication, a generic version of the drug can be produced and sold • Generic drugs have the same effect but are much cheaper compared to brand name drugs • Normally generic drugs have a higher gross profit margin for pharmacy retailers, partially because of generic drug producers have smaller bargaining power • In the next few years, there will be lots of brand drugs lose patents Source: WWW.IBISWORLD.COM
Threats • Pharmacy Benefit Managers • Third party administrator of prescription drug programs, primarily responsible for processing and paying prescription drug claims • Diversified Supermarkets
Pharmacy Benefit Managers • PBMs are the primary contact of the pharmaceutical supply chain to many patients • PBMs’ major tools: • Pharmacy networks: PBMs build networks of retail pharmacies to provide customers convenient access to prescriptions at discounted rates • Mail Service pharmacies: PBMs provide home-delivered prescriptions to consumers • PBMs aggregate the buying clout of millions of enrollees through their client health plans to obtain massive bargaining power over pharmacy retailers • PBMs are encouraging consumers to use their mail service instead of going to pharmacy retailers and also pressing the pharmacy retailers to charge a lower price for the drugs
Pharmacy Benefit Managers • Major players: • Medco Health Solutions 32.3% • CVS Caremark 27.3% • Express Scripts Inc. 21.6% • UnitedHealth Group Inc. 9.8% • Consolidation • Express Scripts acquired Medco Health Solutions with $29.1 billion in 2012 • SXC Health Solutions bought Catalyst Health Solutions with &4.14 billion in 2012
Diversified Supermarkets • Big retailers like Wal-Mart and King Soopers are stepping into the pharmacy supply chain and we’ve already seen pharmacy shops in many supermarkets
Walgreen Co. (NYSE: WAG)Fiscal year ended: Aug. 31, 2012 • Incorporated: 1901 in Illinois, US, retail drug store chain: Prescription, non-prescription drugs and general merchandise • Net sales: $71.6 billion • Net earnings: $2.1 billion • Employees: 240,000 • Prescription sales: 63.2% (2012) vs. 64.7% (2011) Revenue in Millions Source: 2012 Walgreens Annual Report
Number of stores and locations New store growth expansion into new markets Source: 2012 Walgreens Annual Report
June 21, 2011, unable to reach a contract agreement with pharmacy benefit manager Express Scripts, Inc., exited the network as of Jan 1, 2012 sales impact • Signed a multiyear agreement with Express Scripts to participate in its broadest retail pharmacy on Jul 19, 2012 • On Sep 15, customers began to return positive effect on WAG’s net sales, earnings and CFs Source: 2012 Walgreens Annual Report
Launched its innovative Balance Reward loyalty program on Sep 16, 2012 As of Sept 28, 2012 Source: http://investor.walgreens.com/
Strategic partnership with Alliance Boots to create the first global pharmacy-led, health and wellbeing enterprise • Closed on first phase of the transaction in August, acquiring a 45% stake. (Full combination in 3 years) • Investment : $4.0 Billion in cash and 83.4 million common stock • Multinational pharmacy-led health and beauty group • Over 3,330 retail locations in Europe Creating Value Through Synergies Source: 2012 Walgreens Annual Report
Stock Performance Over 5 years CVS SPX WAG RAD Source: Bloomberg
Financial Analysis- Liquidity Measure Quick Ratios: WAG vs. Industry
Financial Analysis- Probability Indicator ROIC: WAG vs. Industry
Financial Analysis- Debt Ratios Debt to Equity: WAG vs. Industry
Financial Analysis • Among Walgreens’ total stores: • 20% owned • 80% leased • Caution: $35,356 mm (PV) of operating leases are not reported on balance sheet, which are their contractual obligations and commitments. • Significantly higher obligation level
Financial Analysis- Operating Performance Inventory Turnover: WAG vs. Industry * Accounting method of booking Alliance Boots acquisition do not allow us to use asset turnover ratio.
Financial Analysis- Investment Valuation Ratios PE ratio: WAG vs. Industry
Financial Projection • Step one: • Invest a total of $6.7 bil. in cash ($4 bil.) and stock (83.4 mil. shares) for 45% equity stake in Alliance Boots • Step two (after 2.5 years; done within 6 months) : • At share price on Aug 2, 2012 and at exchange rate of $1.55=£1, invest a total of $9.5 bil. in cash($4.9 bil.) and stock(144.3 mil. shares)
Financial Projection on Income Statement • Income Statement • 45% of Alliance Boots’ operating income added to year 2013 2014 • 100% of Alliance Boots’ operating income added to year 2015 2016 2017 • Interest expense of $3.5 bil. (w/ 2.2% weighted average interest) added to year 2013 2014 • Interest expense of $4.9 bil. (w/ 2.2% weighted average interest) added to year 2015 2016 2017
Financial Projection on Balance Sheet • Balance Sheet • Use the equity method of accounting • book Alliance Boots’ purchased equity into Walgreens asset • 2012: 1st step, $6.7 bil. cash and stock • 2015: 2nd step, $9.5 bil. cash and stock • Short Term Borrowing • Long Term Borrowing
Short Term and Long Term Borrowing Source: http://investor.walgreens.com/
Comparable Analysis Price = $39.05
Valuation $33.31 $30.84 $39.05
Recommendation HOLD