Download
1 / 7
90 likes | 161 Views
Residues (%) in Domestic Fresh Commodities. Residues (%) in Imported Fresh Commodities. Domestic Fresh n=2401. Imported Fresh n=12,753. Residues (%) Domestic Processed Commodities. Residues (%) Imported Processed Commodities. Domestic Processed n=347. Imported Processed n=322.

E N D
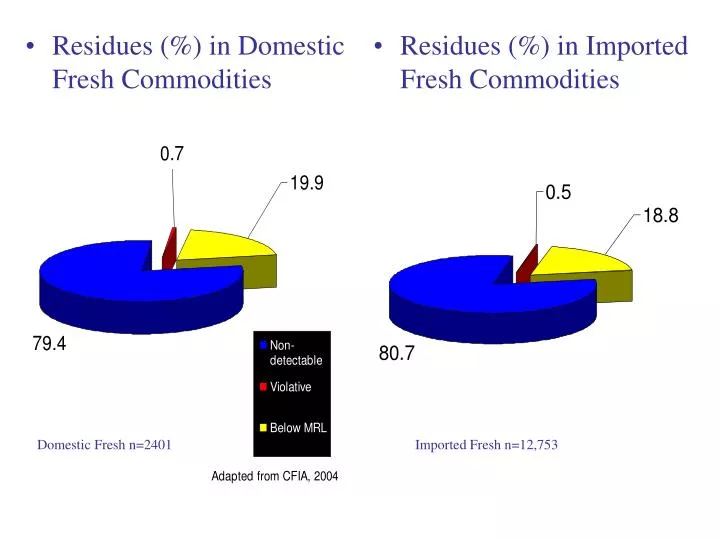
Residues (%) in Domestic Fresh Commodities • Residues (%) in Imported Fresh Commodities Domestic Fresh n=2401 Imported Fresh n=12,753
Residues (%) Domestic Processed Commodities • Residues (%) Imported Processed Commodities Domestic Processed n=347 Imported Processed n=322
Compliance Summary Adapted from CFIA, 2004
Compliance Summary Adapted from CFIA, 2004
Compliance Summary Adapted from CFIA, 2004
Food is very affordable in Canada Source: United States Department of Agriculture, calculated by Economic Research Service data provided by the United Nations System of National Accounts, 1996
Source: United States Department of Agriculture, calculated by Economic Research Service data provided by the United Nations System of National Accounts, 1996