Download
1 / 40
400 likes | 526 Views
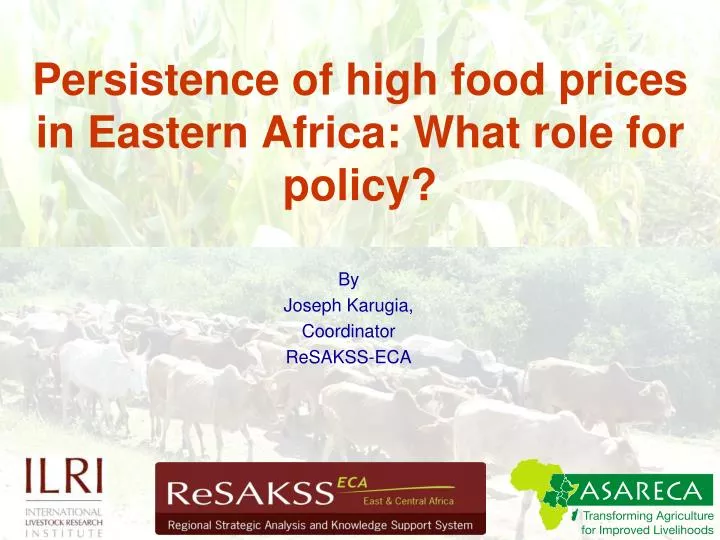
Persistence of high food prices in Eastern Africa: What role for policy?. By Joseph Karugia, Coordinator ReSAKSS-ECA. Outline. Introduction Food Price Situation in ESA Regional Dimensions Recommended Policy Options. Introduction (1).

E N D
Persistence of high food prices in Eastern Africa: What role for policy? By Joseph Karugia, Coordinator ReSAKSS-ECA
Outline • Introduction • Food Price Situation in ESA • Regional Dimensions • Recommended Policy Options
Introduction (1) • Global food price index (FPI) embarked on a downward spiral by July 2008 and remained low and stable for some time • Domestic FPI in Eastern Africa (EA) region on the other hand continued to increase after food crisis, notably in Kenya, Tanzania, Uganda, Ethiopia and Djibouti • In the first half of 2010, global and domestic food prices eased but remained higher than their historical trends
Introduction (2) • The decline did not present any immediate relief to the food crises – largely influenced by good weather conditions • Both global and domestic food prices have risen to historic highs beginning January 2011 • Significant challenge to reduction of poverty and hunger
Comparing FAO Global and EA countries FPIs Source: FAO, 2011; country statistics offices
Objective and Approach • Effective policy action requires evidence based information on the magnitude and implications of price changes at the country and regional level • Approach • Data – continuous update of trends • Consultations among policy advisers, analysts and researchers from national, regional and international organizations
Maize price indices in EA and global 2007=100 Data Source: a) FAO Commodities and Trade Division; b) Ethiopia: Central Statistical Agency; c) Tanzania: Bank of Tanzania; d)Uganda: Uganda Bureau of Statistics; e)Rwanda: RATIN; h) Kenya: Ministry of Agriculture
Rice Price Indices in EA and Global 2007=100 Data Source: a) FAO Commodities and Trade Division; b) Ethiopia: Central Statistical Agency; c) Tanzania: Bank of Tanzania; d)Uganda: Uganda Bureau of Statistics; e)Rwanda: RATIN; f) Zambia: Central Statistical Office (CSO) ; g) Madagascar: Institut National de la Statistique
Wheat Price Indices 2007=100 Data Source: a) FAO Commodities and Trade Division; b) Ethiopia: Central Statistical Agency; c) Zambia: Central Statistical Office; d) Kenya: Ministry of Agriculture
Bean Price Indices 2007 = 100 Data Source: a) FAO Commodities and Trade Division; b) Ethiopia: Central Statistical Agency; c) Tanzania: Bank of Tanzania; d)Uganda: Uganda Bureau of Statistics; e)Rwanda: RATIN; f) Zambia: Central Statistical Office (CSO) ; g) Kenya: Ministry of Agriculture
Meat Price Indices 2007=100 Data Source: a) FAO Commodities and Trade Division; b) Ethiopia: Central Statistical Agency; c) Zambia: Central Statistical Office; d) Rwanda: National Statistical Institute; e) Uganda: Uganda Bureau of Statistics
Milk Price Indices 2007=100 Data Source: a) FAO Commodities and Trade Division; b) Ethiopia: Central Statistical Agency; c) Zambia: Central Statistical Office; d) Uganda: Uganda Bureau of Statistics
Sorghum Price Indices 2007=100 Data Source: a) FAO Commodities and Trade Division; b) Tanzania: Bank of Tanzania; c)Uganda: Uganda Bureau of Statistics; d) Kenya: Ministry of Agriculture
Irish Potatoes Price Indices 2007=100 Data Source: a) Tanzania: Bank of Tanzania; b)Uganda: Uganda Bureau of Statistics; c)Zambia: Central Statistical Office (CSO) ; d) Kenya: Ministry of Agriculture
Sweet Potatoes Price Indices 2007=100 Data Source: a)Uganda: Uganda Bureau of Statistics; b)Kenya: Ministry of Agriculture
Cassava Price Indices 2007=100 Data Source: a)Uganda: Uganda Bureau of Statistics; b)Kenya: Ministry of Agriculture c) Malawi: National statistical office of Malawi
Bananas Price Indices 2007=100 Data Source: a)Uganda: Uganda Bureau of Statistics; b)Kenya: Ministry of Agriculture
Pattern of price changes is mixed • Severity of the problem differs: • across countries • across commodities • time of the year
Change in food prices * Data available up to June 2010; ** Data up to march 2011; *** Teff is main staple food, data not available
Domestic prices are more volatile than global prices... Data source: FAOSTAT (Global), Ministry of Agriculture (Kenya), Central statistics agency (Ethiopia), RATIN (Tanzania and Rwanda), UBOS (Uganda).
Minimal transmission of global price changes to domestic markets... Data Source: RATIN (Kenya, Uganda, Tanzania, Rwanda); Central statistical agency (Ethiopia); FAOSTAT (Global). Correlation coefficients vary between -1 and 1. The closer to 1, the better the integration between the markets. No global and domestic market integration
Some transmission between markets in the region (maize prices)... Data Source: RATIN (Kenya, Uganda, Tanzania, Rwanda); Central statistical agency (Ethiopia) *significant at the 5% significance level +correlation coefficients = maize prices in various markets in EA region tend to move in the same direction, Domestic markets have some degree of integration among themselves, thus price changes will cause flow of food from surplus to deficit areas -exploiting a regional approach
Factors affecting demand for food in EA • Population growth, rising incomes (though inequalities in income distribution make the poor very vulnerable), urbanization • However, demand factors change only slowly and may not be responsible for the recent spikes and volatility
Factors contributing to low supply of food in EA • Low investments in agriculture and rural development • High prices of inputs – fertilizers, fuel, feed • Climatic shocks • Impacts of trade: inefficiencies, expensive imports, policies • Disruption of supply – conflicts
Fuel Price Indices 2007=100 Data Source: a) world: World: US energy information administration independent statistics and analysis; b) Uganda: Bank of Uganda; c) Kenya: Kenya National Bureau of statistics
World Fertilizer Price indices 2007=100 Data Source: World Bank
Differential impact on households • Poor are hit hardest Net sellers less affected • Rural net buyers more affected • Urban poor depend on markets for food supplies
What levers to pull? • Increase production? • Productivity decline, climatic factors,… • Control demand? • Population growth, income inequalities, ... • Many slow to respond; >3 years?
Regional approach offers better prospects • Exploit diversity in the region
Heterogeneity in production ESA harvesting timeline Source: Data: FEWSNET,2008
Busia -Kenya Busia -Uganda Most action is in domestic and regional markets… • But, there are serious barriers to trade: wasteful, high transaction costs
On going policy response measures to high food prices in EA region Sources; World Bank, 2008; FAO, 2008; Karugia et al, 2009; Okello, J.J, 2009; www.wfp.org; www.fao.org Despite the various policy actions adopted in EA region to curb rising food prices, the region has continued to experience persistent high and volatile food prices
Conclusions • Changes in global food prices are not transmitted to domestic markets • Regional response offers opportunities to address the food price crisis • Food price crisis offers opportunities for agricultural development through increased domestic production, regional trade and integration [Paul Romer: “A crisis is a terrible thing to waste”]
Protect the vulnerable • Priority Actions • Targeted food subsidies and cash transfers where markets are working • Targeted food aid where markets are not working • Reduce taxes on food grains • Design and targeting –key to success • For rural poor, in addition provide production support – inputs, credit, technologies
Exploit regional diversity and facilitate regional trade • Priority Actions • Remove export bans • Eliminate NTBs • Simplify trade • Upgrade, maintain infrastructure and facilities on the main trade corridors
Enhance supply response • Priority Actions • Make agricultural inputs affordable • Build on best bet technologies • Exploit economies of scale in input procurement and facilitate trade in inputs • Pilot innovative risk management strategies – warehouse receipt system, index based insurance systems
Strengthen and use regional institutions for preparedness and response • Priority Actions: • Strengthen market information & intelligence (e.g. RATIN,FEWSNET, EAGC) • Institutional frameworks for preparedness, response, and learning