Download
1 / 46
470 likes | 789 Views
FLO-2D Model Development Rio Grande Canalization Project Reach. Presentation to: New Mexico – Texas Water Commission and Paso del Norte Watershed Council Project Completed for: U.S. Army Corps of Engineers and International Boundary and Water Commission March 9, 2006. Jim O’Brien

E N D
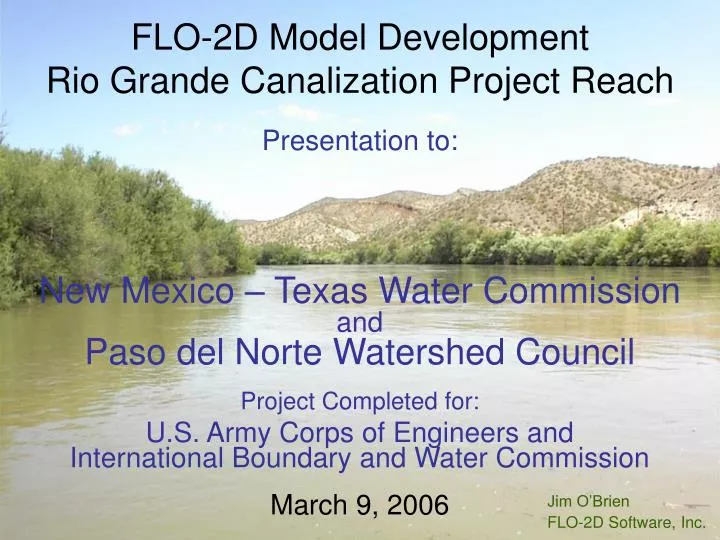
FLO-2D Model Development Rio Grande Canalization Project Reach Presentation to: New Mexico – Texas Water Commission and Paso del Norte Watershed Council Project Completed for: U.S. Army Corps of Engineers and International Boundary and Water Commission March 9, 2006 Jim O’Brien FLO-2D Software, Inc.
Project Purpose The results of the FLO-2D model application will be used to support the development of the URGWOM model for the Rio Grande Canalization Project (RGCP) reach. RGCP FLO-2D model will predict floodplain inundation, water surface elevation and levee inundation or overtopping associated with floodwave attenuation of return period flood events.
Project Components • Hydrology Review • Sediment Supply Review • Field Data Collection Program • FLO-2D Model Development • Model Calibration and Application
Hydrologic Review • Releases from Caballo Reservoir • Design storm selection including point rainfall, distribution and depth-area reduction • Application of the HEC-1 model including rainfall/runoff estimates, assumptions, selected parameters and results
Hydrology Review Results • The combined probability of a 5,000 cfs release during the 100-yr flood is less than 1% on any given year. Used 2,350 cfs average irrigation release instead. • The 100-yr, 24-hr general storm rainfall of 3.8 inches was verified with a frequency analysis of the Jornada Range and Hillsboro rain gage records. • Parameter adjustments to the Corps 1996 RGCP HEC-1 rainfall runoff simulation resulted in higher tributary peak discharge that occurs further upstream.
Flood Hydrology Two Possible Flood Scenarios • 5000 cfs release + 1996 Corps Study tributary flood inflows • Selected: 2,350 cfs release + revised 100-year 24-hr hydrology for tributary flood inflows ~ typical irrigation release
Return Period Flood Modeling The various return period tributary flood inflows using the revised hydrology were simulated with the typical irrigation release of 2,350 cfs. Return period floods were: 2-yr, 5-yr, 10-yr, 25-yr, 50-yr, 100-yr
Sediment Review Objective Reviewed Corps’1996 Rio Grande Canalization Improvement Project, Volume 3, “Sedimentation Analysis from the Rio Grande Tributary Basins” and accompanying appendices
Only sediment supply to the RGCP reach is the steep arroyo sediment Loading Jim O’Brien Tetra Tech, Inc.
Observations • Upstream reservoirs and NRCS arroyo tributary retention dams have created a long term, historical sediment deficit in the river • Channel incision in response to dredging • Armoring of some reaches with local supply of coarse sediment from arroyos
Sediment Review Conclusions • Evidence that there is a sediment deficit in the system • Current tributary sediment supply may not sustain the existing channel morphology in response to future channel maintenance
Sediment Review Conclusions • Corps study was an excellent approach to calculate the total RGCP sediment supply • Corps study overestimated sediment yield for at least 7 of 20 study basins • If sediment yield is overpredicted for the 20 study basins, the regressed relationship will overestimate the sediment yield for all basins
Sediment Review Conclusions (cont.) • Most of the overestimated total load can be attributed to Colby adjustment factor based on wash load concentration and bed material size • Selection of parameters, application of sediment transport equations and supercritical flow assumptions = overpredicted annual sediment yield • Calibrate sediment total load computations to NRCS reservoir survey annual load
Sediment Yield Equation • The equation for total sediment load QT was of the form: • QT = A1 + A2 Ab + A3 Log (Ab) • where: A1, A2, and A3 are regression coefficients and Ab is the basin area.
Sediment Load Adjustment Sediment yield per unit area was plotted as f(basin area). A decreasing power function could be applied to adjust the sediment yield equation as function of the basin area. The derived adjustment equation was: Fa = 5.69 * Ab(-0.3739) where: Fa is the adjustment factor Table 4. Page 8 Report
Recommendation • Use the Dona County DTM to estimate the sediment yield in all the detention basins…might have to create an as-built surface to compare with.
Field Data Collection ProgramJune-July 2004 RGCP Channel Cross Section Survey • Surveyed 145 Cross Sections • Monumented and verified with control • Surveyed levee to levee in most cases • Water surfaces for calibrations at moderate flows (< 2,000 cfs less than bankfull)
CROSS SECTIONS DTM VS GROUND SURVEY Reference elevation for the bridge rating curve was different in the data base
FLO-2D Model Development • DTM Points/Images • Establish FLO-2D Finitie Difference Grid System • Channel Components • Model Details • Infiltration and Evaporation • Levees and Hydraulic Structures • Model Calibration • Flood Results
Data Base DTM Points Images Channel Cross Section Surveys Calibration Data – Inflow and Outflow Discharge All together – this comprises one of the best major river data bases ever assembled. The only difficulty was that there is so damn much of it.
DTM Points • Dona Ana County DTM • The DTM data base was selectively edited along the floodplain • Compiled individual DTM images into 12 files • Each of the 12 files was imported into the GDS and a grid system was overlaid • 12 grid systems were generated using both high and low filters
Basic ‘Riada’ (Big Flood) Results • Area of Inundation • Flood hydrographs every 250 ft of channel • Flood wave attenuation • Levee deficiency and overtopping
Area of Inundation Maps Maps in Report
2004 Water Surface Elevation Calibration Results • Difference between measured and predicted water surface elevation ranged from -0.49 to +0.49 ft • Average difference is 0.03 ft
Flood Hydrographs 2004 Calibration Results Haydon Gage
2004 Calibration Results Leasburg Gage
2004 Calibration Results Mesilla Gage
2004 Calibration Results Anthony Gage
Diversion Dam and Wasteway Operation During Flooding SKIP THIS…unless people have questions
Diversion Dam Operation During Flooding EBID – Percha and Leasburg diversion dams are weirs - no significant change. Open up the by-pass gates and close diversions (8-hour lead time). Want to avoid having the irrigation system inundated. Mesilla diversion dam has gates (12-18 hr lead time) to open the gates. Shut down the canal diversion. Biggest concern is flooding into the irrigation facilities at the diversion.
Diversion Dam Operation During Flooding American Diversion Dam – IBWC Wait until flood arrives. 6 gates are automatically control, 7 gates are manually controlled. Open all gates. Basically have a capacity of 12,000 cfs. Shut canal diversions.
Diversion Dam Operation During Flooding All diversion dams are assumed to be broad crested weirs and open during flooding. The rating curve for passing the flood downstream was estimated using the broadcrested weir equation and a 2.85 coefficient for some loss of efficiency with gate structures.
Wasteway Operation During Flooding Wasteways and drains are affected by backwater during flooding and can cause local flooding. All wasteways have gates (box culvert slide gates) and an effort is made to close all gates during flooding. Water in drains can flood because water continues to flow during flooding. Some watersheds drain into wasteways and deliver flood inflows from tributaries.
Wasteway Operation During Flooding Assumed that all wasteways without flood inflows have closed gates. Levees would have to be overtopped to initiate flooding at wasteway locations. Additional detail can added to the model as local flooding is investigated. There is no operational policy other than to close the gates.
Remaining Issue: Additional roadway or other embankment details Corps agreed that this additional detail is beyond the scope of work and that more detail can be added based on local flood studies and levee improvements.
Potential future benefits • Flood risk and hazard assessment • Flood mitigation – raise levees • Local flood details – levee elevations, wasteways, urban flooding • Revise flood hydrology • River operations • River maintenance response • River restoration response
The End March 9, 2006