Download
1 / 28
400 likes | 968 Views
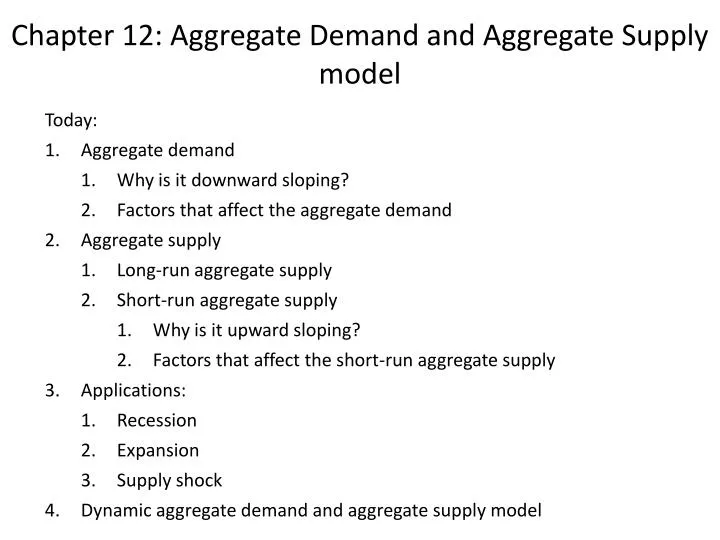
Chapter 12: Aggregate Demand and Aggregate Supply model. Today: Aggregate demand Why is it downward sloping? Factors that affect the aggregate demand Aggregate supply Long-run aggregate supply Short-run aggregate supply Why is it upward sloping?

E N D
Chapter 12: Aggregate Demand and Aggregate Supply model • Today: • Aggregate demand • Why is it downward sloping? • Factors that affect the aggregate demand • Aggregate supply • Long-run aggregate supply • Short-run aggregate supply • Why is it upward sloping? • Factors that affect the short-run aggregate supply • Applications: • Recession • Expansion • Supply shock • Dynamic aggregate demand and aggregate supply model
Chapter 12: Aggregate Demand and Aggregate Supply model A model that explains short-run fluctuations in real GDP and the price level. Aggregate demand curve shows the relationship between the price level and the quantity of real GDP demanded by households, firms, and the government. Short-run aggregate supply curve shows the relationship in the short run between the price level and the quantity of real GDP supplied by firms.
Why Is the Aggregate Demand Curve Downward Sloping? C The Wealth Effect: The impact of the price level on consumption I The Interest-Rate Effect: The impact of the price level on investment NX The International-Trade Effect: The impact of the price level on net exports
The Variables That Shift the Aggregate Demand Curve Changes in Government Policies Monetary policy The actions the Federal Reserve takes to manage the money supply and interest rates Fiscal policy Changes in federal taxes and purchases Changes in the Expectations of Households and Firms If households become more optimistic about their future incomes, they are likely to increase their current consumption. Changes in Foreign Variables If firms and households in other countries buy fewer U.S. goods or if firms and households in the United States buy more foreign goods, net exports will fall, and the aggregate demand curve will shift to the left.
The Long-Run Aggregate Supply Curve shows the relationship in the long run between the price level and the quantity of real GDP supplied. The Long-Run Aggregate Supply Curve
The Short-Run Aggregate Supply Curve Short-run aggregate supply curve slopes upward because: 1 Contracts make some wages and prices “sticky.” 2 Firms are often slow to adjust wages. 3 Menu costs make some prices sticky.
Macroeconomic Equilibriumin the Long Run and the Short Run Long-Run Macroeconomic Equilibrium
Macroeconomic Equilibriumin the Long Run and the Short Run Recessions, Expansions, and Supply Shocks Because the full analysis of the aggregate demand and aggregate supply model can be complicated, we begin with a simplified case, using two assumptions: 1. The economy has not been experiencing any inflation. The price level is currently 100, and workers and firms expect it to remain at 100 in the future. 2. The economy is not experiencing any long-run growth. Potential real GDP is $10.0 trillion and will remain at that level in the future.
Does It Matter What Causesa Decline in Aggregate Demand? The collapse in spending on housing added to the severity of the 2007–2009 recession. Spending on residential construction has declined prior to every recession since 1955.
Recession The Short-Run and Long-Run Effects of a Decrease in Aggregate Demand
Expansion The Short-Run and Long- run Effects of an Increase in Aggregate Demand
Stagflation: A combination of inflation and recession, usually resulting from a supply shock. The Short-Run and Long-Run Effects of a Supply Shock
A Dynamic Aggregate Demandand Aggregate Supply Model We can create a dynamic aggregate demand and aggregate supply model by making three changes to the basic model. • Potential real GDP increases continually, shifting the long-run aggregate supply curve to the right. • During most years, the aggregate demand curve will be shifting to the right. • Except during periods when workers and firms expect high rates of inflation, the short-run aggregate supply curve will be shifting to the right.
What Is the Usual Cause of Inflation? Using Dynamic Aggregate Demand and Aggregate Supply to Understand Inflation
The Slow Recovery from the Recession of 2001 The recession of 2001 was caused by a decline in aggregate demand. Several factors contributed to this decline: • The end of the stock market “bubble.” • Excessive investment in information technology. • The terrorist attacks of September 11, 2001. • The corporate accounting scandals.
The Slow Recovery from the Recession of 2001 Using Dynamic Aggregate Demand and Aggregate Supply to Understand the Recovery from the 2001 Recession
MakingtheConnection • Does Rising Productivity Growth Reduce Employment?
The More Rapid Recovery of 2003–2004 Using Dynamic Aggregate Demand and Aggregate Supply to Understand the More Rapid Recovery of 2003–2004
The Economy in 2007: Continuing Expansion or Looming Recession? In late 2007, economists were divided over whether the twin blows of higher oil prices and a declining housing sector would be sufficient to push the economy into a recession. The majority of economists forecast that growth in real GDP would slow but that the economy would not tip into recession.
Solved Problem Showing the Oil Shock of 1974–1975 on a Dynamic Aggregate Demand and Aggregate Supply Graph