Download
1 / 10
100 likes | 243 Views
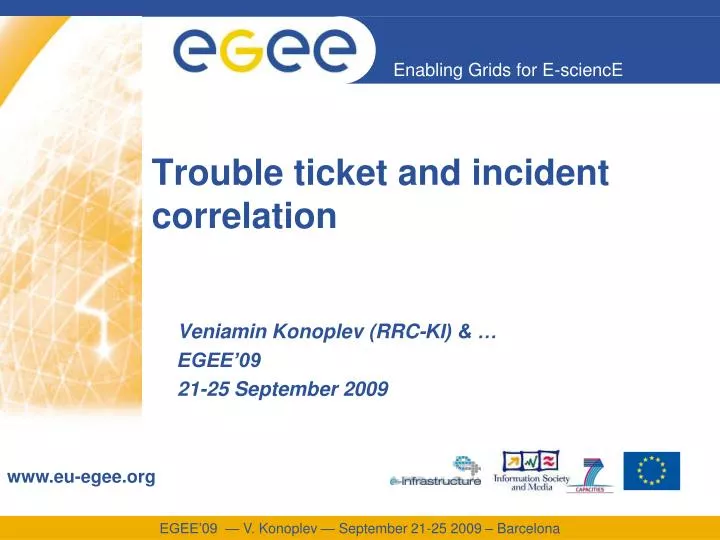
Trouble ticket and incident correlation. Veniamin Konoplev (RRC-KI) & … EGEE’09 21-25 September 2009. Subject history. Current ENOC mission area includes receiving and processing NREN’s TT flow to be aware of potential network connectivity problems that can affect EGEE operation.

E N D
Trouble ticket and incident correlation Veniamin Konoplev (RRC-KI) & … EGEE’09 21-25 September 2009
Subject history • Current ENOC mission area includes receiving and processing NREN’s TT flow to be aware of potential network connectivity problems that can affect EGEE operation. • Smart and proper interpretation of TT content is essential for ENOC as mediator between NREN and EGEE end users. • Statistical trouble ticket (TT) matching approach was proposed at the beginning of EGEE III to facilitate finding correlation of TT content to a part of possibly affected EGEE infrastructure. • Statistical matching approach finds correlations between NREN’s TT content and real observed EGEE node connectivity status. Such correlations observed for a long period are forming a knowledge database. • Starting from Dec 2008 statistical matching prototype was established in RBNET. It has been colleting EGEE node reachability status in terms of: fine,moderate,bad,unreachable. • Principles of this approach as well as first obtained results was reported in EGEE’08, UF’09, DSA2.1. The details are summarized in the technical paper “…”.
Statistical TT matching principles • NREN’s trouble ticket is interpreted as a vector of essential attributes. Currently the following attributes are used: • Problem Interval – begin/end time of problem as reported by NREN • Problem Location – short string describing where the problem arises in terms of NREN’s identification scheme. • Problem Kind – tag describing the problem in unified ENOC classification scheme. Currently this field does not practically used since it is not established during TT preprocessing. • Site connectivity history is summarized in alert database. An alert is represented as interval and severity. • NREN’s TT are matched against NREN’s site alerts forming so called “hit statistic”. • Hit = [Ticket_ID, Location, SITE, Alerts_Severity] • <= from ticket ===> <==== from alert ===> • The hit take place if a site has alerts during a TT time interval. • The hit inherits a severity of hardest alert in the group. • Hit statistic is grouped by: • Location. For each Location in the ticket we track: all TT and TT with hits. • Site-Location. For each site we track: number of hits observed for particular severity. • Metrics extracted from hits statistics and used in TT analysis: • Counts(Location) – number of tickets seen for this location. • Ratio(Location) – percentage of TTs with hits for a particular location. • SiteImpact (Site-Location) – probability to get an alert for particular site if we see TT with particular location. This metric is tracked separately for different severities.
Increasing matching accuracy techniques • Purifying initial TT and Alert data: • TTs and alerts with likely intervals only are taken into account (~ 15min – 4hour). • Detecting group connectivity events • Monitoring intermediate points. I.e. Pinger-to-GEANT uplink and NREN-to-GEANT uplinks. • Check global number of simultaneous active alerts. • Check number of simultaneous active alerts per NREN. • Apply TT and alert interval padding. • Extend TT and alert time intervals by small configurable parameter (0-15min). This allows to reduce time errors (e.g. system clock offset or TT human mistakes). • Put in correspondence data from several alert system located in different places (still pending).
RENATER Network Topology Input data: NREN complexity Typical NREN topology is a rather complex that makes difficult human TT interpretation. This complexity also prevents storing and maintaining detail NRENs topologies in NOD database Number of unique locations seen in NRENs allows to estimate NREN topology complexity
Matching Results (1) • Initial believe of statistical matching as a reliable method to map all essential ticket locations to list of affected sites turned out to be inconsistent. • Main reason – very weak statistic data. Locations with hits count > 1 are seldom • Matching results for GARR from Jan 2009 to Aug 2009 as example are figured below.
Matching Results (2) But current matching results can be used as a part of TT processing workflow. As shown on the table below only 34% of tickets with repeated locations was left” “under the question” for GARR, HEANET and RENATER 56% Tickets with “frequent” Locations Commit as EGEE agnostic 10% Matched to EGEE sites 34% Still under the question
Matching Results (3) Details for matched locations Matching detail for strong criteria (Location-Site has >=3 hits) are shown above. We can see 100% matching accuracy.
Matching Results (4) Details for locations in “grey zone” The list of locations left in grey zone for RENATER
Conclusions • Main practical results: • 76% of repeated locations was considered as “EGEE agnostic” or mapped to EGEE sites • All mapped repeated locations (10%) were with 100% accuracy • The reasons for TT matching fails. • Weak TT statistic. • Only small part of locations was suitable for matching (ticket counts >=3). Part with ticket count >= 4 was really negligible. • Not perfect node status detection. • Matching was performed using data from Smokeping and DownCollector. Smokeping had «not so good» uplink and DownCollector can not track multilevel node status detection. • NREN can improve the content of their tickets • Short and accurate location (RENATER format is a good example) • Short problem severity tag. • Matching results can be used as part TT processing in conjunction with lexicographical and manual location matching. • Further directions: • Tune and improve matching criteria. • Go to combining statistical matching with other methods. • Renew Smokeping config and move it to “good” location. • Add multi-pinger TT processing functionality.