Download
1 / 6
60 likes | 180 Views
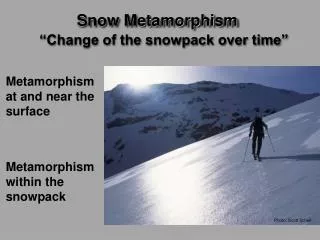
Let It Snow: GPM Cold-season Precipitation Experiment ( GCPEx ) Observations to Improve GPM Satellite Methods for Detecting and Measuring Falling Snow Gail Skofronick Jackson, Code 612, NASA GSFC, Walter Petersen, Code 610.W, Dave Hudak , Environment Canada. DC-8.

E N D
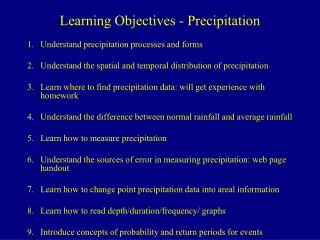
Let It Snow: GPM Cold-season Precipitation Experiment (GCPEx) Observations to Improve GPM Satellite Methods for Detecting and Measuring Falling SnowGail Skofronick Jackson, Code 612, NASA GSFC, Walter Petersen, Code 610.W, Dave Hudak, Environment Canada DC-8 • Falling snow is a component of the Earth’s hydrologic cycle, especially at high latitudes. The Global Precipitation Measurement (GPM) mission’s core satellite (launch 2014) carries active and passive instruments designed to measure precipitation from the heaviest rain rates in hurricanes to falling snow. In order to develop snow algorithms, the GCPEx field campaign was held Jan. 17–Feb 29, 2012 with Environment Canada and other partners 70 km NW of Toronto. Data collection was fully successful with light to heavy snow measured. • GCPEx used a “top down” approach: • DC-8 satellite instrument view • UND Citation and Canadian Convair aircraft: in-cloud snow particle measurements • Ground-based data – snow, rain, and mixed phase precipitation and snowpack at surface • Measurement Statistics: • 17 Flight Mission Days (3 days with all three aircraft, 6 days with 2 aircraft) • 31 total flights: DC-8 (14 separate flights); Citation (12 flights); Convair(5 flights) • All snow event days (Jan 19, 28, 30-31, Feb 10, 11-12, 12, 14, 16, 18, 21, 24, 25) • Rain & mixed phase events (Jan 27, Feb 24) • Four DC8-only “clear air” calibration flights for surface emission (Jan 21, Feb 4, 6-7, 20) Citation, Convair GCPEx Symbol Figure 1: Conceptual sampling strategy. Earth Sciences Division - Atmospheres Figure 2: Measurements from the January 30-31, 2012 snow event.
Name: Gail Skofronick Jackson, NASA/GSFC, Code 612 E-mail: Gail.S.Jackson@nasa.gov Phone: 301-614-5720 References: More information on this highly successful field campaign can be found at http://pmm.nasa.gov/GCPEx This website includes a science plan, flight diagrams, summaries of flights, blog postings, and other general details. Data and detailed forecast, mission science reports and more can be found at http://gpm.nsstc.nasa.gov/gcpex/portal/ (requires login). Credit goes to the 100+ participants that maintained and operated ground and aircraft instrumentation. Domestic and international partners were from NASA, JPL, Environment Canada, Canadian Space Agency, McGill University, Univ. of Manitoba, Univ. of Kohn (Germany), Univ. of Leicester (Britain), Finnish Meteorological Institute, Univ. of Wyoming, Univ. of North Dakota, Duke University, Univ. of Illinois, Univ. of Alabama, Univ. of Wisconsin - Madison, and Colorado State University, and more. We also note that, to date, there has been extensive media coverage of the GCPEx field campaign with mentions in more than 20 online video or live TV segments, 4 NASA feature articles released online, 7 features written by non-NASA, numerous online re-postings, and, finally, our Twitter and Facebook pages are quite active. Data Sources: NASA DC-8 and UND Citation aircraft and ground instruments, CloudSat, NOAA AMSU-B and MHS, DMSP SSMIS, university and international provided instrumentation. Technical Description of Figures: Figure 1: Measurement Strategy Concept: The observing strategy framework is designed to use a combination of multi-frequency radar, particle imaging and water equivalent-measuring surface instrumentation in conjunction with airborne dual-frequency radar, high-frequency radiometer and in-situ microphysics observations arranged in stacked altitude patterns to provide the most complete coupled sampling of surface and in-cloud microphysical properties possible. The “satellite” sampler was the DC-8. The Citation and Convair assumed the roles of in-situ snow samplers. On the ground, we had more than 50 instruments including imagers, radars, radiometers, snow gauges, lidars, radiosondes, and more to measure all aspects of the falling snow. Figure 2: Aircraft and ground measurements from the January 30-31, 2012 synoptic bands of moderate snow rates. Left hand side has flight patterns over- laid on King City radar image, DC-8 observations from GSFC’s Conically-scanning Submillimeter Microwave Imaging Radiometer (CoSMIR) instrument (50-183 GHz passive radiometer), and from JPL’s Advanced Precipitation Radar (APR-2) (Ku and Ka radar). Middle panel shows in-situ imagery from Citation instruments. Right side is a sample of ground data, top to bottom: King City radar, D3R radar, Snow Video Imager (SVI), and imaging camera. Scientific significance: During the GPM pre-launch period physically-based snowfall retrieval algorithms are in an active phase of development. Further refinement and testing of these emerging algorithms requires the collection of targeted ground-validation datasets in snowing environments. The resulting 3D volumes of snow measured during GCPEx will be combined to provide a fundamental description of snowfall physics at the ground and through the atmospheric column, and to create an associated database of scenes for evaluating and developing satellite snowfall retrieval algorithms. Data collected during this field campaign exceeded all expectations, with measurements of heavy (>2 in hr-1), moderate (1-2 in hr-1), and light falling snow rates, along with mixed phase and rain cases. These heavy through light snow cases are ideal for testing the thresholds of detection for falling snow rates using GPM-like sensors. All budgeted and available DC-8 and Citation aircraft hours were used for these important science flights. Note that despite the small snowfall amounts over the Northeastern part of the USA, the Great Lakes region had plenty of synoptic and lake effect snow during the experiment. Relevance for future science and relationship to Decadal Survey: The GCPEx field campaign is directly related to the upcoming GPM mission as well as current satellite sensors with the ability to detect falling snow. GCPEx will seek to address unknowns and assumptions in GPM snowfall retrieval algorithm by collecting microphysical properties, associated remote sensing observations, and coordinated model simulations of precipitating snow. These data sets will be collected toward achieving the overarching goal of GCPEx which is to characterize the ability of multi-frequency active and passive microwave sensors to detect and estimate falling snow. Earth Sciences Division - Atmospheres
Satellite observations of darkening of Himalayan snowpack by desert dust deposition Ritesh Gautam, N. Christina Hsu, William K. Lau, Teppei J. Yasunari, Code 613, NASA GSFC The Himalayas are among the largest ice-covered regions of the Earth's surface, outside the poles, and their glaciers form a source of major rivers in Asia, that serve a large population base downstream. Recent studies have shown climate warming, accelerated snowmelt over the elevated Himalayas as well as perturbations to the Asian summer monsoon rainfall, partly due to enhanced absorption of solar radiation by natural and anthropogenic aerosols. Prior to the onset of the summer monsoon, mineral dust lifted from Southwest Asian deserts and from as far as the Arabian Peninsula, is transported over South Asia on a seasonal basis. Mixed with anthropogenic pollution, mineral dust forms a widespread vertically extended brown haze lapping against the southern slopes of the Himalayas. Episodic dust plumes are also advected over the Himalayas, leading to dust-capped snow surfaces. Fundamentally, aerosol deposition over snow surface can lead to accelerated snowmelt due to darkening of snow surface i.e., reduction of snow albedo and enhanced absorption of solar radiation. From an observational viewpoint, this study utilizes spaceborne measurements of reflectivity over the Himalayan snow cover to estimate the reduction of snow albedo induced by dust deposition. b a c d Western Himalayas Snow Cover >95% Figure 1:(a) Satellite image of a major dust outbreak over South Asia, on 9 June 2003, leading to dust-capped snow surface in the western Himalayas (highlighted in red); (b) Top of Atmosphere spectral reflectivity over dust-capped western Himalayas (red) and relatively clean Karakoram snow surface; (c) Intra-seasonal variations of spectral reflectivity over western Himalayas snow surface; (d) theoretical calculations of reflectivity of pure snow mixed with different levels of dust impurity. Earth Sciences Division - Atmospheres
Name: Ritesh Gautam, NASA/GSFC, Code 613 and Universities Space Research Association E-mail: ritesh.gautam@nasa.gov Phone: 301-614-6126 References: 1. Gautam, R., N. C. Hsu, S. C. Tsay, K. M. Lau, B. Holben, S. Bell, A. Smirnov, C. Li, R. Hansell, Q. Ji, S. Payra, D. Aryal, R. Kayastha, and K. M. Kim (2011), Accumulation of aerosols over the Indo-Gangetic plains and southern slopes of the Himalayas: distribution, properties and radiative effects during the 2009 pre-monsoon season, Atmos. Chem. Phys., 11, 12841-12863, doi:10.5194/acp-11-12841-2011. 2. Lau, K. M., M. K. Kim, K. M. Kim, W. S. Lee (2010), Enhanced surface warming and accelerated snow melt in the Himalayas and Tibetan Plateau induced by absorbing aerosols, Env. Res. Lett., doi:10.1088/1748-9326/5/2/025204. 3. Yasunari, T. J., R. D. Koster, K.-M. Lau, T. Aoki, Y. C. Sud, T. Yamazaki, H. Motoyoshi, and Y. Kodama (2011), Influence of dust and black carbon on the snow albedo in the NASA Goddard Earth Observing System version 5 land surface model, J. Geophys. Res., 116, D02210, doi:10.1029/2010JD014861. Data Sources: MODIS Level-1b reflectance and snow cover fraction data in swath format were mapped onto a co-located 2by 2 degree resolution uniform grid, and MODIS top-of-atmosphere spectral reflectivity measurements over snow covered regions (constrained by snow cover fraction data) were used for analysis. Technical Description of Figures: Figure 1: This study utilizes multispectral satellite observations of visible to shortwave-infrared reflectivity over the Himalayan snow cover from the Moderate Resolution Imaging Spectroradiometer (MODIS) to understand the impacts of aerosol deposition on snow albedo reduction. We focus on the pre-monsoon season (May-June) when episodic dust plumes transported from southwest Asian desert regions are advected over western Himalayas, resulting in vertically extended brown haze as seen in Terra/MODIS imagery on 9 June 2003 (a). Case studies of dust-capped snow surface (b) as well as intra-seasonal variations (c) of reflectivity at top-of-atmosphere are examined at six wavelengths from 0.47 to 2.1μm to characterize the seasonal change in albedo and infer the dust-induced contribution to its reduction. The spectral signature yields a significant gradient with shorter wavelengths (visible) being most sensitive to snow contamination, whereas near- and shortwave-infrared spectrum remains relatively unaffected by snowpack pollutiondue to greater dependence on snow physical properties compared to impurities. In contrast to observations over western Himalayas, relatively clean snow cover such as further northwest in the Karakoram mountains are characterized by a flatter spectrum (a), thus suggesting the role of ageing and melting processes in less contaminated snow. The satellite observations of snow-melt and -contamination induced changes in reflectivity, especially at the visible wavelengths, seem to be consistent with theoretical snow-impurity based radiative calculations (d). For the theoretical sensitivity calculations, we utilized spectral mass absorption coefficient of mineral dust and converted them to complex index of refraction – which were further input to the Kokhanovsky-Zege snow reflectance model, at selected sun-satellite geometry, to calculate reflectivity of pure snow mixed with different concentrations of dust impurity. Scientific significance: Using satellite measurements of top-of-atmosphere reflectivity, we demonstrate the effects of absorbing aerosol transport and deposition in the reduction of Himalayan snow albedo, especially the role of transported mineral dust causing enhanced absorption at the shorter visible wavelengths. Snow darkening, as a result of absorbing aerosol deposition, can lead to accelerated snowmelt thereby potentially affecting the cryospheric reservoirs of the Himalayas-Tibetan Plateau. Consequently, snow albedo reduction may lead to a warmer regional climate with possible impacts on the summer monsoon circulation and rainfall distribution, and therefore the overall hydrological cycle of southern and eastern Asia. Relevance for future science and relationship to Decadal Survey: Results from this observational work can provide better understanding of the radiative impact of aerosols over snow surface, especially over the Himalayas, as well as other cryospheric regions that are subjected to transport and accumulation of absorbing aerosols such as dust and black carbon. Earth Sciences Division - Atmospheres
First balloon sondeprofile measurements of volcanic and urban SO2 for validation of OMI SO2 retrievals Henry B. Selkirk (GESTAR/Code 614, NASA GSFC), Gary Morris (Valparaiso University), Jorge Andrés Diaz (Universidad de Costa Rica), NickolayKrotkov (Code 614, NASA GSFC) and HolgerVömel (DeutscherWetterdienst, Lindenburg Observatory) Since we began making regular ozone soundings in Costa Rica (Selkirk et al, 2010), numerous ozone profiles have shown deep notches below 5 km. We speculated that these were due interference of the ozone measurement by SO2 emitted from Turrialba, an active volcano 35 km ENE of our launch site in San José. To test this, we launched a dual ozone sonde payload on February 3, 2012, following the technique developed in Morris, et al. (2010). As shown in Fig. 1, we were able to detect a 15 ppbv layer of SO2 just below 4 km as well as a lower layer about 500 m above the surface. While the lower layer is likely due to urban pollution, the trajectories in Fig. 2 show that the source of the upper layer was very likely to have been the volcano. The SO2 column computed from the balloon sonde profile is 1.4 DU. As shown in Fig. 3, this falls squarely in the range of 1-1.7 DU retrieved by the Aura/OMI instrument overflying just three hours later. With the near-constant fumarolic activity at Turrialba, further profile measurements at San José will very likely provide an opportunity to improve the OMI retrievals of SO2 (Yang et al., 2007). Figure 1: Profiles of ozoneand sulfurdioxide mixing ratios and potential temperature, dual ozone sonde launch at San José, Costa Rica [9.94°N, 84.04°W] 1559 UT February 3, 2012. Thick lines, ascent profiles (a), thin lines, descent (d). Figure 2:HYSPLIT trajectories initiated at 12 UT, 3 February 2012 at 3.6, 3.8 and 4 km from the locus of VolcanTurrialba (triangle; elev. 3340 m) . Yellow oval at location of sondeascent at 15 UT. Figure 3:SO2 column retrievals over Costa Rica from the Aura/OMI instrument at 1851 UT on February 3, 2012. Triangle and yellow oval as in Figure 2. Earth Sciences Division - Atmospheres
Name: Henry B. Selkirk, GESTAR/NASA GSFC Code 614 E-mail: Henry.B.Selkirk@nasa.gov Phone: 301-614-6846 References: Morris, G. A., W. D. Komhyr, J. Hirokawa, J. Flynn, B. Lefer, N. Krotkov, and Fong Ngan (2010), A Balloon Sounding Technique For Measuring SO2 Plumes, Journal of Atmospheric and Oceanic Technology,27, 1318-1330, doi:10.1175//2010JTECHA1436.1 Selkirk, H. B., H. Vömel, J. M. Valverde Canossa, L. Pfister, J. A. Diaz, W. Fernández, J. Amador, W. Stolz, and G. S. Peng (2010), Detailed structure of the tropical upper troposphere and lower stratosphere as revealed by balloon sonde observations of water vapor, ozone, temperature, and winds during the NASA TCSP and TC4 campaigns, Journal of Geophysical Research, 115, D00J19, doi:10.1029/2009JD013209. Yang, K., N. A. Krotkov, A. J. Krueger, S. A. Carn, P. K. Bhartia, and P. F. Levelt (2007), Retrieval of large volcanic SO2 columns from the Aura Ozone Monitoring Instrument: Comparison and limitations, Journal of Geophysical Research, 112, D24S43, doi:10.1029/ 2007JD008825. Data Sources: (Figure 1) The Tico-Ozonesondeballoonsonde project at the Universidad de Costa Rica is a NASA-supported collaboration among Dr. Jorge Andrés Diaz at UCR, Dr. Henry B. Selkirk at GESTAR/NASA GSFC, Dr. HolgerVömel of the DeutscherWetterdienst, and Dr. Bryan Johnson at NOAA/ESRL. Prof. Gary Morris of Valparaiso University supervised the preparation of the dual ozonesonde payload and performed the SO2 profile calculations. (Figure 2) HY-SPLIT trajectories courtesy of NOAA/ARL. (Figure 3) Operational lower tropospheric SO2 column retrievals available from NASA DISC archive at http://disc.sci.gsfc.nasa.gov/Aura/data-holdings/OMI/omso2_v003.shtml. Technical Description of Figures: Figure 1: The dual ozone sonde payload consists of two electrochemical concentration cell (ECC) ozone sondes mounted in tandem, one with an SO2 filter attached to the inlet. The reaction with SO2 in the ECC cathode cell is the stoichiometric opposite of the O3 reaction. Thus, provided the SO2 mixing ratio is lower than the ambient ozone and the two ozone sondes are well calibrated, the SO2 mixing ratio can be derived by differencing the two sondes. Figure 2: Output from the NOAA Hybrid Single Particle Lagrangian Integrated Trajectory (HYSPLIT) Model at http://ready.arl.noaa.gov/HYSPLIT_traj.php. The model was run in Normal mode with GDAS archive winds. Figure 3: This is the 3-km OMI SO2 product which assumes the center of mass of the SO2 to be at 3 km. Columns amounts are given in Dobson units (DU) which is the number of molecules of gas that would be required to create a layer 0.01 millimeters thick at a temperature of 0 degrees Celsius and a pressure of 1 atmosphere. Scientific significance: SO2 is both a significant pollutant in urban regions and an important trace gas emitted by volcanoes around the world with importance both to human health and to the natural environment. While satellite remote sensing measurements provide world-wide column coverage, retrievals are sensitive to SO2’s vertical structure, hence the importance of in situ profiling. Furthermore, while volcanic plumes are episodic even in regions close to active volcanoes, near-surface layers of SO2 in polluted urban environments may well be going undetected and in the process inducing unknown negative bias into single-sonde ozone profiles in those locations. Relevance for future science and relationship to Decadal Survey: Aura OMI will continue monitoring anthropogenic and natural volcanic SO2 pollution sources from space to detect trends in this important pollutant and aerosol precursor to provide an overlap with recently launched Ozone Monitoring and Profiling suite (OMPS) on the US Next generation weather satellite Suomi-NPP. The Decadal Survey recommended the Geostationary Coastal and Air Pollution Events (GEO-CAPE) Tier 2 mission which is planned to launch after 2020. It will allow more frequent monitoring of anthropogenic NO2 and SO2 pollution over North and Central America. A next generation OMI-like sensor (TROPOMI) is planned for launch by ESA in 2015 as a Sentinel-5 precursor mission; it will measure SO2 with an increased ground resolution of 7 km by 7 km. All of these satellite measurements will benefit from in situ profiling of SO2. Earth Sciences Division - Atmospheres