Download
1 / 19
200 likes | 368 Views
7.20 Describing Climate. ONScience 10 Quantitative Graphs and Comparative Zone Systems Climatographs, Climate Zones, Ecoregions, Bioclimatic Profiles. Climatographs. Climatographs Provide a quantitative breakdown of temperature and precipitation Shows fluctuation seasonally.

E N D
7.20 Describing Climate ONScience 10 Quantitative Graphs and Comparative Zone Systems Climatographs, Climate Zones, Ecoregions, Bioclimatic Profiles
Climatographs Climatographs • Provide a quantitative breakdown of temperature and precipitation • Shows fluctuation seasonally
Constructing Climatographs • the letters along the bottom of the graphs identify the months of the year starting with "J" for January • plot the dot in the middle of the bar for all months then join with a smooth curving line to indicate the temperature conditions (the scale is given at the left in Celcius) • Convention: when using colour this line is usually 'red' • twelve vertical bars which indicate the average monthly amount of precipitation. Use the millimetre (mm) scale to the right to measure the amounts- • Convention: when using colour the bars are usually coloured in 'blue'
Climate Zones • Russian Scientist Vladimir Köppen • In 1884, he published the first version of his map of climatic zones in which the seasonal temperature ranges were plotted. • Köppen’s work was published as the Köppen climate classification system around 1900, and was modified several times until 1936. • The Köppen system of classification is based on • temperature • precipitation • plant communities • Several other scientists have added to Köppen's work and have “cloned” his system, i.e.: Trewartha climate classification
Köppen Classification System Source: http://wpcontent.answers.com/wikipedia/commons/thumb/3/32/World_Koppen_Map.png/400px-World_Koppen_Map.png
Köppen Climate Zones • The Köppen system recognizes five major climatic types; each type is designated by a capital letter. • A - Tropical Moist Climates: all months have average temperatures above 18° Celsius. • B - Dry Climates: with deficient precipitation during most of the year. • Two “B” subgroups, S - semiarid or steppe, and W - arid or desert • C - Moist Mid-latitude Climates with Mild Winters. • D - Moist Mid-Latitude Climates with Cold Winters. • E - Polar Climates: with extremely cold winters and summers. • Two subgroups, T – tundra, and E - icecap. • Canada has no type A regions
Köppen Climate Zones • Further subgroups are designated by a second, lower case letter which distinguish specific seasonal characteristics of temperature and precipitation. • f - Moist with adequate precipitation in all months and no dry season. This letter usually accompanies the A, C, and D climates. • m - Rainforest climate in spite of short, dry season in monsoon type cycle. This letter only applies to A climates. • s - There is a dry season in the summer of the respective hemisphere (high-sun season). • w - There is a dry season in the winter of the respective hemisphere (low-sun season). • To further denote variations in climate, a third letter was added to the code. • a - Hot summers where the warmest month is 22°C or greater. These can be found in C and D climates. • b - Warm summer with the warmest month below 22°C. These can also be found in C and D climates. • c - Cool, short summers with less than four months over 10°C in the C and D climates. • d - Very cold winters with the coldest month below -38°C (-36°F) in the D climate only. • h - Dry-hot with a mean annual temperature over 18°C in B climates only. • k - Dry-cold with a mean annual temperature under 18°C in B climates only.
Köppen’s Climatic Map of CanadaSource: Government of Canada, Natural Resources Canada ET EF Cfb Dfc Dfb Csb Dfa BSk
Other Classifications • Several other classification systems exist for climate. These include classification by: • Ecoregions • Bioclimates
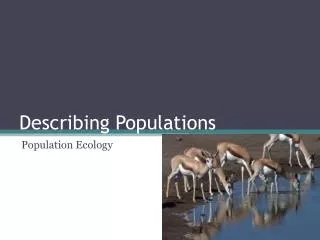
Ecoregions • Another way to classify a climate zone. Ecoregions focus on the ecology of a region. This classification looks at: • Landforms • Soil • Plants • Animals • Climate • There are 867 global Ecoregions • Complete classifications is done by: • Zones • Provinces • Regions • Districts
Example of Classification Source: http://sis.agr.gc.ca/cansis/nsdb/ecostrat/intro.html
Terrestrial Ecoregions of Canada Source: http://atlas.nrcan.gc.ca/site/english/maps/archives/5thedition/environment/ecology/mcr4164/?maxwidth=1600&maxheight=1400&mode=navigator&upperleftx=0&upperlefty=0&lowerrightx=5352&lowerrighty=4704&mag=0.125
From - http://www.ec.gc.ca/soer-ree/English/Framework/Nardesc/Canada_e.cfm
Bioclimate Profiles • Series of Graphs which describe only temperature and moisture conditions for a location • Describe climate conditions and predict possible changes over next 40-80 years. Source: http://www.utoronto.ca/imap/
15 From - http://www.dbs-sar.com/images/World_ecoregion.bmp
From - http://www.on.ec.gc.ca/wildlife/wildspace/wsimages/ws-map-ontforest.gif
Methods of describing Climate Ecoregions • Also consider landforms, plants, soil type and animals • 867 global Ecoregions • SUBDIVIDED • Zones, • Provinces, • Regions • Districts Source: http://www.fs.fed.us/rm/ecoregions/images/maps/ecoregions-north-america.gif
Methods of describing Climate Bioclimatic Profiles • Describe only climatic Conditions • Describe climate conditions and predict possible changes over next 40-80 years From - http://www.planthardiness.gc.ca/images/cfs11x8E.jpg