Download
1 / 23
310 likes | 847 Views
A data table has three titles. Independent variable (IV) is on the left side of the data table. Dependent variable (DV) is on the right side of the data table. Data arranged in rows and columns. Data Tables. Average Daily Temperature for January 1-5

E N D
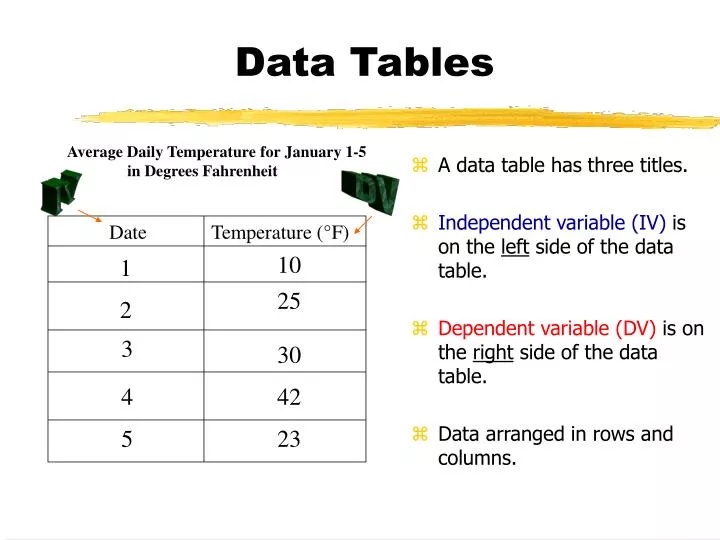
A data table has three titles. Independent variable (IV) is on the left side of the data table. Dependent variable (DV) is on the right side of the data table. Data arranged in rows and columns. Data Tables Average Daily Temperature for January 1-5 in Degrees Fahrenheit IV DV Date Temperature (°F) 10 1 25 2 3 30 4 42 5 23
Overview Step 1 Step 2 Step 3 Step 4
Step 1 All graphs start here! • Draw and label both axes. y 0 x
Variables Step 2 y • x- axis : Independent variable • y- axis : Dependent variable DV Title 0 IV Title x
All graphs have • THREE TITLES!
Titles • 3 labels per graph: - Main title that describes the graph - x-axis - y-axis • The titles come from the data table.
Investigation 5 Step 3 Cars in the Teachers’ Parking Lot y • Make a title for your graph. Number of Each 0 Type of Car x
Bar Graphs used for descriptive or grouping information (compares data) Examples:Type of ---, color, weight, height, shape, amount, etc. Bar or Line????? Step 4
Bar or Line????? Step 4 Line Graphs Used when you collect information over time Examples: hours, days, months, years, decades, seconds, centuries, minutes, weeks, temperature, etc.
Quick Review Step 1 Step 2 Step 3 Step 4
Range • From lowest to highest.
Bar - y axis DV info • Number the y-axis only! • Use an increment small enough to cover entire graphing space but large enough to include highest number. Cars in the Teachers’ Parking Lot Number of Each Step 5a Type of Car
Step 6a Bar - x axis • Write the groups (words) from the left side of the data table Cars in the Teachers’ Parking Lot Number of Each IV info Chevy Dodge Ford Honda Mazda Toyota Volvo Type of Car
Step 7a Bar Graph • Draw the bars. Cars in the Teachers’ Parking Lot Number of Each IV info Chevy Dodge Ford Honda Mazda Toyota Volvo Type of Car
Quick Review Step 1 Step 2 Step 3 Step 4 Step 5a Step 6a Step 7a
Increments • The numbers on the axis. - Line graph: x and y axis=range • Equal to multiples large enough to include highest number. (ex: 5, 10, 15, 20 or 100, 200, 300, 400 or 1, 2, 3, 4……)
Line - y axis DV info • Number the y-axis! • Use an increment small enough to cover entire graphing space but large enough to include highest number. Scores on a Science Test Scores (points) Step 5b Amount of Study Time (hrs.)
Line- x axis Step 6b • Number the x-axis! • Use an increment small enough to cover entire graphing space but large enough to include highest number. Scores on a Science Test Scores (points) IV info 0 1 2 3 4 5 6 Amount of Study Time (hrs.)
Ordered Pairs • Two numbers that join together to make a point on a graph. ( x, y) (2, 3)
Plot your ordered pairs. Step 7b Scores on a Science Test Scores (points) 0 1 2 3 4 5 6 Amount of Study Time (hrs.)
Connect the dots in order! Step 8b Scores on a Science Test Scores (points) 0 1 2 3 4 5 6 Amount of Study Time (hrs.)
Summary Step 1 Step 2 Step 3 Step 4 Step 5a Steps 5 & 6b Step 7b Step 6a Step 8b Step 7a