Download

1 / 18
180 likes | 186 Views
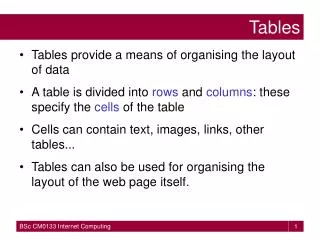
Data Tables & Graphing. What is a data table?. A data table is an organized arrangement of information in labeled rows & columns. Why do we use data tables?. In science, we use them to record observations. They help us interpret information collected in an experiment. Parts of a Data Table.

E N D
What is a data table? • A data table is an organized arrangement of information in labeled rows & columns.
Why do we use data tables? • In science, we use them to record observations. • They help us interpret information collected in an experiment.
Parts of a Data Table • Title: number, underlined, describes what the data is about. • Table #1 Effects of Fertilizer on Plant Growth • Box: rows & columns • Headings: above columns or to the left of rows; describes data
Data Table Practice #1 • Record the amount of kids wearing tennis shoes, sandals, & boots in your class.
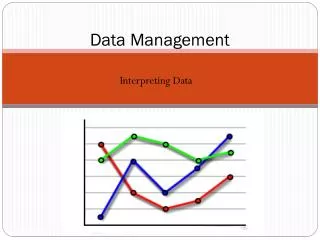
What is a graph? • A graph is a pictorial representation of the relationship between two quantities. • Independent variable (manipulated) • Controlled by experimentor • Dependent variable (responding) • Something we observe as the result of the experiment
Graph Types • Bar graphs • Line graphs • Circle Graphs
Bar Graphs • A bar graph is a diagram in which data about separate but related items are compared. • Place the categories on the horizontal axis. • Place the measurements on the vertical axis.
Line Graphs • Remember “DRY MIX” • Dependent or Responding variable is plotted on the Y-axis. • Manipulated or Independent variable is plotted on the X-axis.
Circle Graphs • A circle graph shows data as parts of a whole.
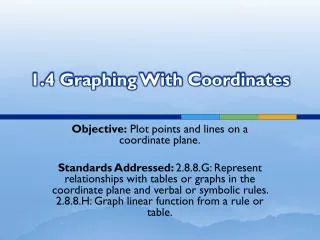
Graphing Rules • Use GRAPH PAPER!!!!! • Title: number (Graph #1), underlined, describes what data is about. • Draw x-axis horizontally, and y-axis vertically. • Label the x-axis with the independent variable heading and the y-axis with the dependent variable heading.
Graphing Practice • Identify the variables as independent & dependent variables.
Examples • The world population per year • I=year • D=population • Temperature & breathing rate in fish • I=temperature • D=breathing rate
Examples • Height of plants per day • I=day • D=height • The number of minutes animals can hold their breath • I=type of animal • D=number of minutes
Examples • The amount of rain in different environments • I=environment • D=amount of rain • The amount of body fat in different age groups • I=age group • D=amount of body fat
Examples • The grade you make vs. the minutes you study • I=minutes you study • D=grade you make • Heart rate & breathing rate at various temperatures • I=temperature • D=heart rate & breathing rate