Download
1 / 1
10 likes | 99 Views
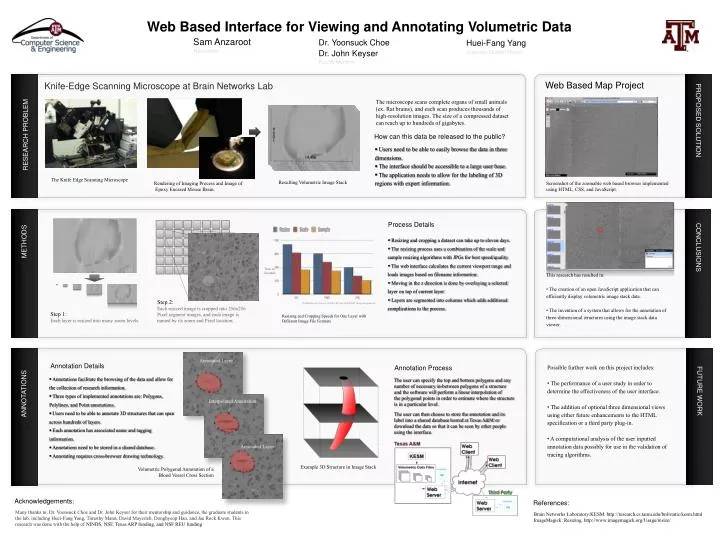
Web Based Interface for Viewing and Annotating Volumetric Data. Sam Anzaroot. Dr. Yoonsuck Choe. Huei-Fang Yang. Researcher. Dr. John Keyser. Graduate Student Mentor. Faculty Mentors. nknk. Web Based Map Project. Knife-Edge Scanning Microscope at Brain Networks Lab.

E N D
Web Based Interface for Viewing and Annotating Volumetric Data Sam Anzaroot Dr. Yoonsuck Choe Huei-Fang Yang Researcher Dr. John Keyser Graduate Student Mentor Faculty Mentors nknk Web Based Map Project Knife-Edge Scanning Microscope at Brain Networks Lab The microscope scans complete organs of small animals (ex. Rat brains), and each scan produces thousands of high-resolution images. The size of a compressed dataset can reach up to hundreds of gigabytes. RESEARCH PROBLEM How can this data be released to the public? PROPOSED SOLUTION • Users need to be able to easily browse the data in three dimensions. • The interface should be accessible to a large user base. • The application needs to allow for the labeling of 3D regions with expert information. The Knife Edge Scanning Microscope Resulting Volumetric Image Stack Rendering of Imaging Process and Image of Epoxy Encased Mouse Brain. Screenshot of the zoomable web based browser implemented using HTML, CSS, and JavaScript. METHODS nknk Process Details • Resizing and cropping a dataset can take up to eleven days. • The resizing process uses a combination of the scale and sample resizing algorithms with JPGs for best speed/quality. • The web interface calculates the current viewport range and loads images based on filename information. • Moving in the z direction is done by overlaying a selected layer on top of current layer. • Layers are segmented into columns which adds additional complications to the process. Time in Seconds • This research has resulted in: • The creation of an open JavaScript application that can efficiently display volumetric image stack data. • The invention of a system that allows for the annotation of three-dimensional structures using the image stack data viewer. CONCLUSIONS Step 2: Each resized image is cropped into 256x256 Pixel segment images, and each image is named by its zoom and Pixel location. On Machine w/ Xeon 2.4 GHZ CPU and 4GB RAM using imagemagick. Step 1: Each layer is resized into many zoom levels. Resizing and Cropping Speeds for One Layer with Different Image File Formats nknk Annotated Layer ANNOTATIONS Annotation Details • Possible further work on this project includes: • The performance of a user study in order to determine the effectiveness of the user interface. • The addition of optional three dimensional views using either future enhancements to the HTML specification or a third party plug-in. • A computational analysis of the user inputted annotation data possibly for use in the validation of tracing algorithms. Annotation Process • Annotations facilitate the browsing of the data and allow for the collection of research information. • Three types of implemented annotations are: Polygons, Polylines, and Point annotations. • Users need to be able to annotate 3D structures that can span across hundreds of layers. • Each annotation has associated name and tagging information. • Annotations need to be stored in a shared database. • Annotating requires cross-browser drawing technology. The user can specify the top and bottom polygons and any number of necessary in-between polygons of a structure and the software will perform a linear interpolation of the polygonal points in order to estimate where the structure is in a particular level. Interpolated Annotation The user can then choose to store the annotation and its label into a shared database hosted at Texas A&M or download the data so that it can be seen by other people using the interface. FUTURE WORK Annotated Layer Example 3D Structure in Image Stack Volumetric Polygonal Annotation of a Blood Vessel Cross Section Acknowledgements: References: Brain Networks Laboratory:KESM. http://research.cs.tamu.edu/bnl/static/kesm.html ImageMagick: Resizing, http://www.imagemagick.org/Usage/resize/ Many thanks to: Dr. Yoonsuck Choe and Dr. John Keyser for their mentorship and guidance, the graduate students in the lab, including Huei-Fang Yang, Timothy Mann, David Mayerich, Donghyeop Han, and Jae Rock Kwon. This research was done with the help of NINDS, NSF, Texas ARP funding, and NSF REU funding