Download
1 / 65
650 likes | 839 Views
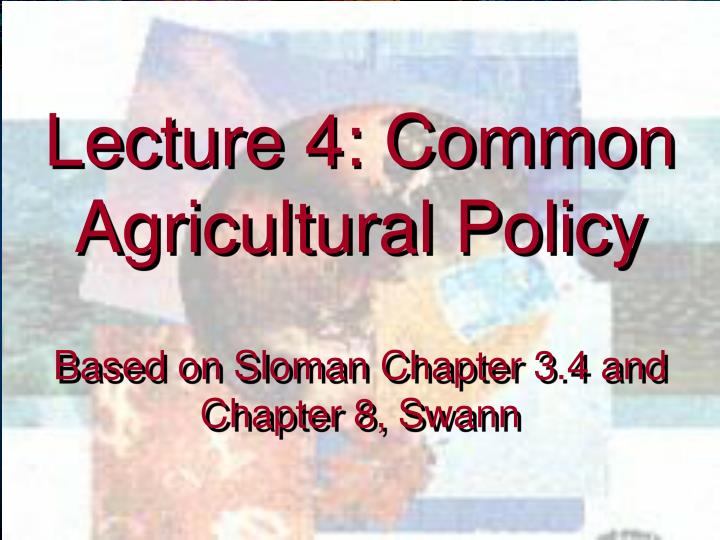
Lecture 4: Common Agricultural Policy Based on Sloman Chapter 3.4 and Chapter 8, Swann. CAP- The Common Agricultural policy. Massively complex, massively expensive policy. Hard to understand without seeing how it developed. CAP started as simple price support policy in 1962.

E N D
Lecture 4: Common Agricultural Policy Based on Sloman Chapter 3.4 and Chapter 8, Swann
CAP- The Common Agricultural policy • Massively complex, massively expensive policy. • Hard to understand without seeing how it developed. • CAP started as simple price support policy in 1962. • Objective: To stabilise prices • AND provide income support for social reasons
Farm Size Distribution in EU(1987) • Very skewed ownership: • biggest 7 per cent of farmers owned ½ of the land • smallest 50 per cent of farmers owned only 7 per cent of the land. Source: Baldwin & Wyplosz
Changes in Farm size 1970-1987 Source: Baldwin & Wyplosz
AGRICULTURE AND AGRICULTURAL POLICY • Agriculture • Many producers, all price takers • Many consumers, all price takers • ‘free’ entry and exit • As close to perfect competition as could imagine • So why intervene in Agriculture sector?
AGRICULTURE AND AGRICULTURAL POLICY • Why governments intervene in agriculture • to reduce price fluctuations • to raise farm incomes • to protect rural communities • to encourage greater self-sufficiency in food • Causes of short-term price fluctuations • fluctuations in demand & instability • fluctuations in the harvest
P Suppose we have a crop which takes a year to grow and is grown only once year, e.g. Hops for Beer SA Suppose now that demand were to rise but supply cannot respond immediately P1 a DA Q1 O Q fig
P Suppose we have a crop which takes a year to grow and is grown only once year, e.g. Hops for Beer SA Suppose now that demand were to rise but supply cannot respond immediately P1 a What will happen to Price? DA Q1 O Q fig
P Since supply is fixed, the price is determined by the available supply at Q1. SA P2 So price rises to P2 P1 a DB DA Q1 O Q fig
But next period farmers observe that the price of hops was very high • So now they all want to grow hops • At P2, what will the supply be?
P SA At P2, the following year supply increases to Q3 P2 P1 a DB DA Q1 O Q3 Q fig
P SA But now Supply exceeds demand so price must fall to P3 P2 P3 P1 a DB DA Q1 O Q3 Q fig
P SA But next period farmers see lower price and decide to supply less: Q4 P2 P3 P1 a DB DA Q1 O Q4 Q3 Q fig
P SA Notice here that we are spiraling through time to an equilibrium P2 P3 This is a stable Cobweb P1 a DB DA Q1 O Q4 Q3 Q fig
P Suppose instead that the supply curve was very flat. SA Now what will happen to Price? P1 a DA Q1 O Q fig
P Suppose instead that the supply curve was very flat. SA Now what will happen to Price? P1 a DA Q1 O Q fig
P Since supply is fixed, again the price must rise to P2 SA P1 a DB DA Q1 O Q fig
P Since supply is still fixed at Q1, again the price must rise to P2 SA P2 But next period farmers observe that the price of hops was very high So now they all want to grow hops P1 a DB DA Q1 O Q fig
P At P2, what will the supply be in this case? SA P2 P1 a Now Supply Increases to Q5 DB DA Q1 O Q Q5 fig
But again Supply exceeds demand so price must fall to P5 P SA P2 P1 a P5 DB DA Q1 O Q Q5 fig
But at P5 next period farmers decide to supply Q6 P SA P2 P1 a P5 DB DA Q1 O Q Q6 Q5 fig
P6 But if only Q6 is supplied demand will exceed supply and price will rise to P6 SA P2 P1 a P5 DB DA Q1 O Q Q6 Q5 fig
But Now the price and quantity are gradually spiraling away from equilibrium. This is an unstable cobweb. P6 SA P2 P1 a P5 DB DA Q1 O Q Q6 Q5 fig
Summary of Cobweb Effects • With a demand SHIFT and supply fixed yearly, a sudden rise in demand will see a big increase in income. • The lagged response next year can generate cyclical fluctuations in prices over the next few years. • When Q goes up and P fall, income PxQ can also fluctuate. • Not all cobwebs are stable
P Supply Side Shock SRSA SRSE LRS is the long-run supply curve. SRSE is the expected supply this year. LRS PA e PE SRSA is the actual supply this year. e.g. Bad harvest D QA QE O Q fig
P Supply Side Shock SRSA SRSE So price rises, what about income? PEeQEO=ab is expected income LRS PA c e PE ac= actual income Overall depends on size of c relative to b a b D QA QE O Q fig
P Supply Side Shock SRSA SRSE PA If demand is more inelastic, c>b and income rises. LRS c e PE ac= actual income Overall depends on size of c relative to b a b D QA QE O Q fig
P Supply Side Shock SRSE SRSA But if it is a good crop and demand is inelastic, LRS c < b and income falls So variability in incomes leads to pressure for government intervention e PE b PA a c D QE O QA Q fig
REASONS FOR INTERVENTION • Causes of short-term price (and income?) fluctuations • fluctuations in demand • fluctuations in the harvest (supply) • Causes of declining farm incomes • low income elasticity of demand • increases in supply
Decline in farm incomes over time 1 P S1 P1 D1 Q1 O Q
Decline in farm incomes over time 1 P S1 An improvement in farm efficiency! S2 P1 But with inelastic demand, income will fall as before P2 D1 Q1 Q2 O Q
Decline in farm incomes over time 2 P S1 How might farmers gain? Need an increase in demand due to rising income in other sectors. S2 But if demand does not move out much there may be no income gain P1 P2 D2 D1 Q2 Q1 O Q
Decline in farm incomes over time 3 P If income elasticity of demand is low, the D curve only moves out a little and there may be no income gain S1 S2 P1 P2 D2 D1 Q1 Q2 O Q
Evidence on Income elasticities of demand for various foodstuffs Source: Sloman from; National Food Survey 2000 (National Statistics, 2001), extracted from Tables 6.1, 6.3, 6.4 and 6.5 Note NEGATIVE values imply these are inferior goods so demand falls as income rises
RECAP on REASONS FOR INTERVENTION in Competitive market • Causes of short-term price fluctuations • fluctuations in demand • fluctuations in the harvest (supply) • Causes of declining farm incomes • increases in supply • low or negative income elasticity of demand
AGRICULTURE AND AGRICULTURAL POLICY • Types of government intervention in agriculture • buffer stocks • subsidies • high fixed prices • reducing supply • structural policies
Buffer stocks to stabilise prices P Existed in all six original member states Pg D Q1 O Q
Buffer stocks to stabilise prices 1 P Sa1 Pg Bought into buffer stock D Qs1 Q1 O Q
Buffer stocks to stabilise prices 2 P Sa2 Pg Released from buffer stock D Q1 Qs2 O Q
Buffer stocks to stabilise prices 3 P Sa2 But income still fluctuating, now worse Pg Extra income in good times Income in Bad Times Normal D Q1 Qs2 O Q
AGRICULTURE AND AGRICULTURAL POLICY • Buffer stocks • buffer stocks to stabilise prices • buffer stocks to stabilise farm incomes
Recall Elasticity Formula If elasticity equals 1 it means the percentage increase in quantity is the same as the percentage fall in prices So if the percentage price and income change is the same then income stays the same
Buffer stocks to stabilise incomes P a P1 D O Q
Buffer stocks to stabilise incomes P Ped= -1 a P1 Y D O Q
Buffer stocks to stabilise incomes 1 P Sa1 Sa2 a P1 Y D Q2 Q1 O Q
Buffer stocks to stabilise incomes P Sa1 Sa2 a P1 Y P2 D Q2 Q1 O Q
Buffer stocks to stabilise incomes P Sa1 Sa2 Bought into buffer stock a P1 b P2¢ Y c P2 D Q2¢ Q2 Q1 O Q
Buffer stocks to stabilise incomes 2 P Sa1 Sa3 a P1 Y D Q3 Q1 O Q
Buffer stocks to stabilise incomes P Sa1 Sa3 P3 a P1 Y D Q3 Q1 O Q
Buffer stocks to stabilise incomes P Sa1 Sa3 Released from buffer stock P3 e d P3¢ a P1 Y D Q3¢ Q3 Q1 O Q