Download
1 / 11
110 likes | 323 Views
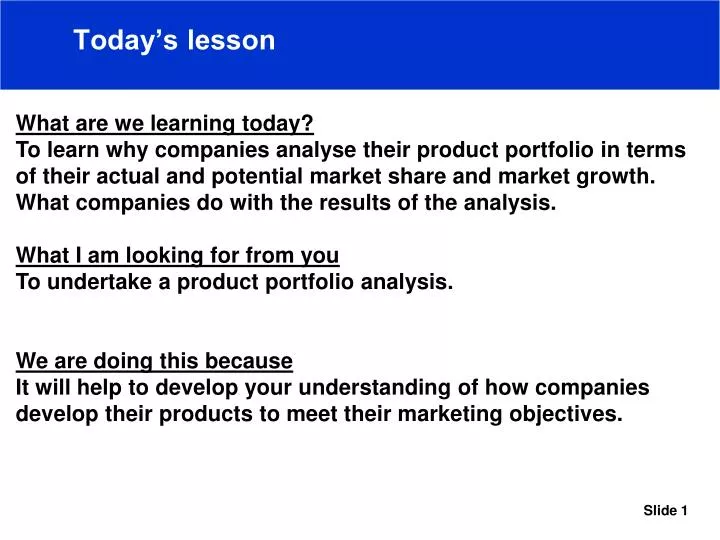
Today’s lesson. What are we learning today? To learn why companies analyse their product portfolio in terms of their actual and potential market share and market growth. What companies do with the results of the analysis. What I am looking for from you

E N D
Today’s lesson What are we learning today? To learn why companies analyse their product portfolio in terms of their actual and potential market share and market growth. What companies do with the results of the analysis. What I am looking for from you To undertake a product portfolio analysis. We are doing this because It will help to develop your understanding of how companies develop their products to meet their marketing objectives.
Starter – Product Portfolio Analysis Group 1…Have a think about the Volkswagen group…make a list of how many brands do they have in their portfolio…Here is a starter for you. Seat….Can you get all 7 of them? And list as many products from ONE brand you can think of. Group 2…Can you think of a number of products that have been established for a long time that have a high market share but a low market growth?
Volkswagen… Its product portfolio FOX POLO GOLF JETTA 10 basic model in 123 variants sold in the UK alone as at June 2006! BEETLE PASSAT PHAETON TOUAREG SHARAN TOURAN
Boston Matrix – Product Portfolio Analysis This is a method of ANALYSING THE MARKETPOSITION of a firm's existing products. It can also help companies compare their products market size and grow in comparison to another company’s. It is used TOGETHER WITH the PRODUCT LIFE CYCLE as part of the marketing planning process and ‘What do we do next?’
Boston Matrix – Product Portfolio Analysis Low market share % High market share % High market growth % Where would you place a DOG, a CASH COW, a RISING STAR and a PROBLEM CHILD Low market growth %
Product Life Cycle – BMW 3 Series Sales Decline / Dog Growth / Rising Star Why do BMW keep releasing another 3 series? Maturity & Saturation / Cash Cow Introduction / Problem Child 1975-82 1982-1990 1990-1998 1998-2006 2006 ->
Boston Matrix – Product Portfolio Analysis Low market share % High market share % High market growth % Excellent products with high growth and high market share; but need constant advertising. Big investment to develop and advertise to start with but it has big sales potential for the future. Profits from Cash Cows help fund new products. Sales made with little investment. Sales are falling and it may be taking profit to keep the dog alive. Low market growth %
Cash Cows? Can you think of a number of products that have been established for a long time that have a high market share but a low market growth?
Chocolate!!! http://www.cadbury.co.uk/EN/CTB2003/about_chocolate/brand_stories/ • Cadbury • Mars http://www.mars.com/The_Mars_Directory/index.asp • Nestlé http://www.nestle.co.uk/ProductNewsAndOffers/AboutOurBrands/ConfectioneryAndCakes/Conf+Products+-+home.htm These companies sell many brands of chocolates, in the UK and abroad. In pairs, using the internet sites produce a list of all the chocolate brands/products AND using the Boston Matrix place these brands/products in Dogs, Rising Stars, Cash Cows or problem children.