Download
1 / 23
230 likes | 539 Views
B. The log-rate model Statistical analysis of occurrence-exposure rates. References. Laird, N. and D. Olivier (1981) Covariance analysis of censored survival data using log-linear analysis techniques. Journal of the American Statistical Institute, 76(374):231-240

E N D
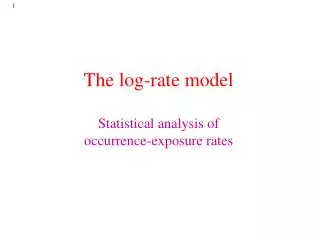
B. The log-rate modelStatistical analysis of occurrence-exposure rates
References Laird, N. and D. Olivier (1981) Covariance analysis of censored survival data using log-linear analysis techniques. Journal of the American Statistical Institute, 76(374):231-240 Holford, T.R. (1980) The analysis of rates and survivorship using log-linear models. Biometrics, 36:299-305 Yamaguchi, K. (1991) Event history analysis. Sage, Newbury Park, Chapter 4:’Log-rate models for piecewise constant rates’
The log-rate model: the occurrence matrix and the exposure matrix Occurrences: Number leaving home by age and sex, 1961 birth cohort: nij Exposures: number of months living at home (includes censored observations): PMij
ij = E[Nij] PMij fixed The log-rate model offset The log-rate model is a log-linear model with OFFSET (constant term)
The log-rate model Multiplicative form Addititive form Ln(PM): offset : linear predictor The log-rate model is a log-linear model with OFFSET (constant term)
The log-rate model in two steps • Use the model to predict the counts (predict counts from marginal distribution of occurrences and from exposures): IPF • Estimate parameters of log-rate model from predicted values using conventional log-linear modeling • The model:
The log-rate model in SPSS: unsaturated model Model and Design Information: unsaturated model Model: Poisson Design: Constant + SEX + TIMING Parameter Estimates Asymptotic 95% CI Parameter Estimate SE Lower Upper 1 -3.9818 .0694 -4.12 -3.85 2 .5070 .0878 .33 .68 3 .0000 . . . 4 -1.3044 .0897 -1.48 -1.13 5 .0000 . . .
The log-rate model in SPSS: unsaturated model PM *exp[ ] = RATE 9114*exp[-3.982 ] = 170.0 0.01865 16202*exp[-3.982-1.304 ] = 82.0 0.00506 15113*exp[-3.982-1.304+0.507] = 127.0 0.00840 4876*exp[-3.982+ 0.507] = 151.0 0.03096
The log-rate model in GLIM: unsaturated modelOcc = Exp * exp[overall + sex] DATA: Occurrence matrix and exposure matrix (2*2) [i] $fit +sex$ [o] scaled deviance = 218.48 (change = -14.80) at cycle 4 [o] d.f. = 2 (change = -1 ) [o] [i] $d e$ [o] estimate s.e. parameter [o] 1 -4.275 0.05997 1 [o] 2 -0.3344 0.08697 SEX(2) [o] scale parameter taken as 1.000 Females 278 = 19989 * exp[-4.275] RATE = exp[-4.275] = 0.0139 Males 252 = 25316 * exp [-4.275 - 0.3344] RATE = exp [-4.275 - 0.3344] = 0.0100 [i] $d r$ [o] unit observed fitted residual [o] 1 135 210.19 -5.186 [o] 2 74 161.28 -6.873 [o] 3 143 67.81 9.130 [o] 4 178 90.72 9.163
The log-rate model in GLIM: unsaturated modelOcc = Exp * exp[overall + sex + timing]
Related models • Poisson distribution: counts have Poisson distribution (total number not fixed) • Poisson regression • Log-linear model: model of count data (log of counts) • Binomial and multinomial distributions: counts follow multinomial distribution (total number is fixed) • Logit model: model of proportions [and odds (log of odds)] • Logistic regression • Log-rate model: log-linear model with OFFSET (constant term) Parameters of these models are related
The unsaturated log-linear model • Assume: two-way classification; counts unknown but marginal totals given • Predict the expected counts (cell entries)
The unsaturated log-linear model as a log-rate model Odds ratio = 1
Updating a table: THE LOG-RATE MODEL IN TWO STEPS Odds ratio = 2.270837