Download
1 / 27
270 likes | 360 Views
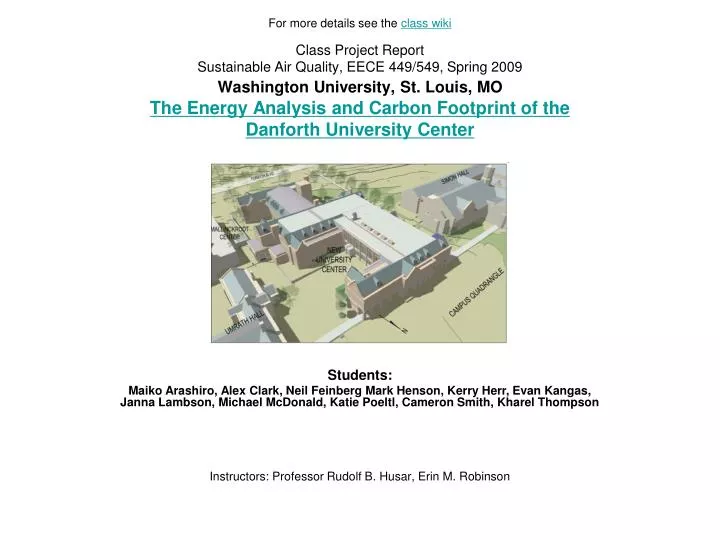
For more details see the class wiki. Class Project Report Sustainable Air Quality, EECE 449/549, Spring 2009 Washington University, St. Louis, MO The Energy Analysis and Carbon Footprint of the Danforth University Center. Instructors: Professor Rudolf B. Husar, Erin M. Robinson. Students:

E N D
For more details see the class wiki Class Project ReportSustainable Air Quality, EECE 449/549, Spring 2009Washington University, St. Louis, MOThe Energy Analysis and Carbon Footprint of the Danforth University Center Instructors: Professor Rudolf B. Husar, Erin M. Robinson Students: Maiko Arashiro, Alex Clark, Neil Feinberg Mark Henson, Kerry Herr, Evan Kangas, Janna Lambson, Michael McDonald, Katie Poeltl, Cameron Smith, Kharel Thompson
DUC Energy and Carbon Analysis • The goal of the of the project was to analyze the energy use and carbon footprint of DUC • The analysis is based on the hourly data for electricity, gas and chilled water and hot water • The analyses were performed by EECE449 class with help from J. Biggs and the instructors Results • In March-April 09 the end use energy consumption at DUC was: hot water (43%), electricity (23%), cold water (23%) and gas( 10%) • For gas, the >90% of the consumption was during the daytime hours; for electricity and water, the consumption occurred throughout the day. • The carbon footprint of DUC is dominated by the consumption of electricity (53%).
Class Project: Energy Analysis and Carbon Footprint of the Danforth University Center Specific Objectives: Analyze energy usage in the DUC Apportion the energy use to activities in the DUC Determine carbon footprint of the DUC Renewable energy analysis for electricity
DUC Space Usage Offices Meeting Rooms Kitchen Dining and Social Areas The LEED Report indicates the space breakdown as: DUC
Raw Data Analysis—Time Series Charts and Daily Averages, March 11 – April 29, 2009
Electricity Distribution Diagram - Dynamic Measured DATA Estimated Values
AHU-1 Supply Fan Daily Pattern EnergyUsage Air Flow Rate
DUC HVAC – AHU-1 Energy Recovery Wheel, Btu Exhaust Air Intake Energy Results during the Monitoring Period Btu’s Reduction = 3,420,000 Btu’s Wasted = 5,730,000 $$ = ?? Carbon = ?? Heat Recovery Hot and Chill Water Hot Water Coil Chilled Water Coil Hot Water VAV Box VAV Box VAV Box DUC
Cool and Hot Water Data from March 12-April 15 2009
Cool and Hot Water Yearly Extrapolation Estimated yearly cold water usage: 6121 MMBtu Estimated yearly hot water usage: 7039 MMBtu • Estimated annual costs: • Cool water: $18,464 • Hot water: $61,584 • Estimated annual CO2 emissions: • Cool water: 310 metric tons • Hot water: 436 metric tons
Energy coming into the DUC This energy is the amount metered at the DUC in MMBTUs
“MEASURED” VERSUS ACTUAL ENERGY USAGE CONVERSION BASIS: 1 kW/ton Refrigeration 80% Boiler Efficiency
Coal Power Analysis • Consideration of powering the DUC entirely on coal power (close to reality): • No square feet of area need to be set aside by school • Costs roughly $8.50/hr or $0.045/kWhr (operation, maintenance, and distributed capital costs) • Over time period of our data (March 12 – Present) this option would have cost about $7,500 or $9,500 when factoring in the “social cost” of carbon. • Pros: • Cheap, cheap, cheap • Doesn’t need area set aside for it, the power company already handled that • Cons: • Over the same time period above, the DUC would have 50 metric tons of carbon emissions associated with this electricity generation. • Burning of coal also releases significant amounts of sulfur, which can lead to acid rain.
Breakdown of Office Electricity Usage by Activity Used power densities in LEED certification to find electricity usage of equipment and lighting Other usage inferred from percentages given by EIA
Graph of Electricity Consumption of Offices Compared to Total DUC Electricity Consumption
Breakdown of Meeting Room Electricity Usage by Activity Used power densities in LEED certification to find electricity used for lighting Other usage inferred from percentages given by EIA There is a baseline of electricity consumption from cooling and ventilation
Graph of Electricity Consumption of Offices Compared to Total DUC Electricity Consumption
Energy Breakdown in DUC Kitchen: Weekday • According to national data, Energy use in restaurants and industrial kitchens can be divided into 5 categories, and energy is consumed in those areas in these proportions: • We used real time DUC data on Natural gas usage to calculate overall DUC kitchen energy usage
Energy Breakdown in DUC Kitchen: Weekend • Energy usage is much lower on the weekends than during the week. • Peaks still occur at traditional meal times, but they aren’t as high.