Download
1 / 26
270 likes | 440 Views
SPIE 7734, Optical and Infrared Interferometry II, San Diego, June 2010. STELLAR INTENSITY INTERFEROMETRY Astrophysical targets for sub- milliarcsecond imaging. Dainis Dravins, Hannes Jensen Lund Observatory, Sweden Stephan LeBohec, Paul D. Nuñez The University of Utah, Salt Lake City.

E N D
SPIE 7734, Optical and Infrared Interferometry II, San Diego, June 2010 STELLAR INTENSITY INTERFEROMETRY Astrophysical targets for sub-milliarcsecond imaging Dainis Dravins, Hannes Jensen Lund Observatory, Sweden Stephan LeBohec, Paul D.NuñezThe University of Utah, Salt Lake City
Intensity interferomety: What, Why & How?
Narrabri intensity interferometer with its circular railway track R.Hanbury Brown: BOFFIN. A Personal Story of the Early Days of Radar, Radio Astronomy and Quantum Optics (1991)
Flux collectors at Narrabri R.Hanbury Brown: The Stellar Interferometer at Narrabri Observatory Sky and Telescope 28, No.2, 64, August 1964
Intensity interferometry Pro:Time resolution of 10 ns, say, implies 3 m light travel time; no need for more accurate optics nor atmosphere. Short wavelengths no problem; hot sources observable Con:Signal comes from two-photon correlations, increases as signal squared; requires large flux collectors
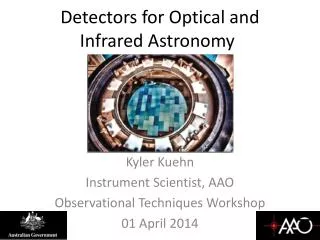
MAGIC VERITAS CANGAROO III H.E.S.S. AIR CHERENKOV TELESCOPES
CTA, Cherenkov Telescope Array (2018?) An advanced facility for ground-based gamma-ray astronomy
Digital intensity interferometry • Cherenkov telescopes: Large flux collectors • Fast digital detectors & high-speed signal handling • Combine optical telescopes in software • Huge number of baselines, no loss of digital signal • 65 CTA telescopes: N(N-1)/2 = 2080 baselines • Filled (u,v)-plane enables sub-milliarcsecond imaging
S/N in intensity interferometry • PROPORTIONAL TO: • Telescope areas (geometric mean) • Detector quantum efficiency • Square root of integration time • Square root of electronic bandwidth
S/N in intensity interferometry • PROPORTIONAL TO: • Telescope areas (geometric mean) • Detector quantum efficiency • Square root of integration time • Square root of electronic bandwidth • Photon flux per optical frequency bandwidth
S/N in intensity interferometry • PROPORTIONAL TO: • Telescope areas (geometric mean) • Detector quantum efficiency • Square root of integration time • Square root of electronic bandwidth • Photon flux per optical frequency bandwidth • INDEPENDENT OF: • Width of optical passband
OBSERVATIONS IN INTENSITY INTERFEROMETRY Stellar diameters for different temperatures and different apparent magnitudes. Dashed lines show baselines at which different diameters are resolved.
Original estimate of possible S/N as function of the stellar temperature For stars with same angular diameter but decreasing temperatures (thus decreasing fluxes), telescope diameter must successively increase to maintain the same S/N. When the mirrors become so large that the star is resolved by a single mirror, S/N drops. For stars cooler than a given temperature, no gain results from larger mirrors. R.Hanbury Brown, R.Q.Twiss: Interferometry of the intensity fluctuations in light III. Applications to astronomy, Proc.Roy.Soc.LondonSer.A, 248, 199 (1958)
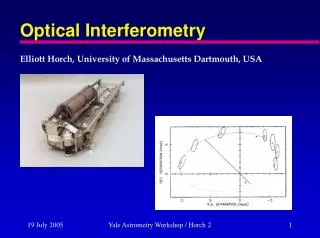
SIMULATED OBSERVATIONS IN INTENSITY INTERFEROMETRY Verification of simulation software against classical observations by Hanbury Brown et al. Left: Sirius observed with the Narrabri stellar interferometer (R.Hanbury Brown, J.Davis, R.J.W.Lake & R.J.Thompson; MNRAS 167, 475, 1974) Right: Simulated observations with Narrabri instrumental parameters
SIMULATED OBSERVATIONS IN INTENSITY INTERFEROMETRY Squared visibility (“diffraction pattern”), of a stellar disk of angular diameter 0.5 mas. Z = normalized second-order coherence
SIMULATED OBSERVATIONS IN INTENSITY INTERFEROMETRY Squared visibility from a close binary star. Left: Pristine image; Right: Logarithm of magnitude of Fourier transform
OBSERVATIONS IN INTENSITY INTERFEROMETRY Simulated measurements of a binary star with CTA-B telescope array Left: Short integration time (noisy); Right: Longer integration time. Color scale shows normalized correlation.
SIMULATED OBSERVATIONS IN INTENSITY INTERFEROMETRY Limiting magnitude mv= 3 mv= 5 mv= 7 Simulated observations of binary stars of visual magnitudes 3, 5, and 7. Total integration time: 20 hours; wavelength 500 nm, time resolution 1 ns, quantum efficiency=70% Array: CTA D
Simulated observations of binary stars OF different size (mV=3; Teff=7000 K; T=10 h; t=1 ns; =500 nm; QE=70%, array = CTA B) Top: Reconstructed and pristine images; Bottom: Fourier magnitudes. Already changes in stellar radii by only a few micro-arcseconds are well resolved.
SIMULATED OBSERVATIONS IN INTENSITY INTERFEROMETRY S/N independent of spectral passband Simulated observations of rotationally flattened star with emission-line disk Left: Pristine image, 0.4 mas across with 10 µas equatorial emission-line disk, 6 times continuum intensity Center: Observed magnitude of the Fourier transform in continuum light Right: Same for a narrow-bandpass filter at He I 587 nm emission Stellar magnitude: mv= 6, Teff= 7000 K; T = 50 h, QE=70%; Array = CTA I
Top: StARSshapeD by rapid rotation; Middle: DISKS & WINDS; Bottom: STELLAR SURROUNDINGS
NON-RADIAL PULSATIONS & VELOCITIES ACROSS STELLAR SURFACES Observations through very narrow bandpass filters, spanning one spectral line (might require ordinary telescopes rather than Cherenkov ones) Simulated observations of a Cepheid-like star undergoing non-radial pulsations mV=3.4; Teff=7000 K; Δt=1 ns; =500 nm; Array=CTA B Left: Pristine image; Right: ObservedFouriermagnitude
“Our local Universe is teeming with stars, but despite 400 years of telescopic observations, astronomy is still basically incapable of observing stars as such! Although we can observe the light radiated by them, we do not (with few exceptions) have the capability to observe the stars themselves, i.e., resolving their disks or viewing structures across and outside their surfaces (except for the Sun, of course!). One can just speculate what new worlds will be revealed once stars no longer will be seen as mere point sources but as extended and irregular objects with magnetic or thermal spots, flattened or distorted by rapid rotation, and with mass ejections monitored in different spectral features as they flow towards their binary companions. It is not long ago that the satellites of the outer planets passed from being mere point sources to a plethora of different worlds, and one might speculate what meager state extragalactic astronomy would be in, were galaxies observed as point sources only.” (Dravins & LeBohec, SPIE Proc. 6986, 2008) In 2009, we celebrated 400 years of telescopic astronomy