Download
1 / 18
180 likes | 292 Views
Canada’s Dual VAT. George Anderson Forum of Federations Conference on Making the 18th Amendment and the NFC Award Work Islamabad October 30-31, 2010. Provinces and territories (date of entry into Confederation) and % share of 2009 population of 33.6 million.

E N D
Canada’s Dual VAT George Anderson Forum of Federations Conference on Making the 18th Amendment and the NFC AwardWork Islamabad October 30-31, 2010
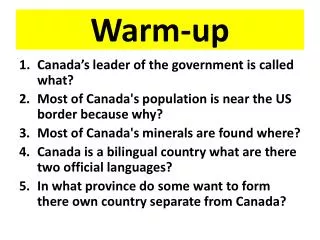
Provinces and territories (date of entry into Confederation) and % share of 2009population of 33.6 million North-West Territories (1870) 0.1% Yukon (1898) 0.1% Nunavut (1999)0.1% Newfoundland& Labrador (1949) 1.5% British Columbia (1871) 13.2% Alberta (1905) 10.9% Québec (1867) 23.2% Prince EdwardIsland (1873) 0.4% Ontario (1867)38.7% Manitoba (1870) 3.6% Nova Scotia (1867) 2.8% New Brunswick (1867) 2.2% Saskatchewan (1905) 3.1% A quick overview of Canada 3
75% 75% 65% 66% Expenditures Revenues 61% 60% 53% 45% 45% Federal share of direct spending Federal share of own-source revenues 50% 50% 41% 37% 37% 25% 25% 0% 0% Switzerland Canada Germany Australia USA Switzerland Canada Germany Australia USA Canadian provinces have a high degree of autonomy including significant fiscal resources and independence 4
Federal transfers as a % of total revenues of other levels of government 100% 40% Non-federal own-source revenues,by degree of fiscal control 75% 30% 7% 30% 39% 39% 41% 50% 20% 87% 19% 18% 100% 100% 15% 10% 25% 61% 52% 0% 0% 13% USA Australia Germany Switz. Canada Canada Germany Australia Switz. USA Revenue sharing with federal government Federated entities set only the tax rate Federated entities set tax rates and base The particularly high degree of autonomy exercised by Canadian provinces reflects: Their low dependence on federal transfers… …and significant control over their own-source revenues 5
Revenues (% of GDP) Expenditures (% of GDP) 50% 50% 40% 40% Provincial-local 30% 30% Provincial-local 20% 20% Transfers Federal Federal 10% 10% 0% 0% 1933 1933 1943 1943 1947 1947 1950 1950 1953 1953 1956 1956 1959 1959 1962 1962 1965 1965 1968 1968 1971 1971 1974 1974 1977 1977 1980 1980 1983 1983 1986 1986 1989 1989 1992 1992 1995 1995 1998 1998 2001 2001 2004 2004 Source: Statistics Canada There is a long history of fiscal decentralization in Canada going back to the post-war period. It has been driven by provincial powers and responsibilities and Canada’s political dynamics 6
The federalshare of governmentspendingaftertransfersisexceptionallylow
Canada’s Transition to Value AddedTax Federalgovernmenthadmanufacturing sales taxwhichprovided 15% of revenues Nine provinces had sales taxes, withdifferent rates and designs 1991 Federal GST and Quebec QST 1997 Newfoundland, New Brunswick, and Nova Scotiajoin HST 2010 Ontario and British Columbia join HST Onlythreesmall provinces still have conventional sales taxes outside the HST system. Alberta and territories have no sales tax.
Whysuch a long transition? • Extremelydifficultpolitics • Manufacturing sales taxwashidden; GST/QST/HST usuallyaddedat point of sale sohighly visible • Provinces hadverydifferent designs and usuallymuchsmaller bases (thoughoftenhigher rates) • Public not sensitive to economicbenefits, but business lobbiedstrongly for change • Federalgovernment has had to bribe provinces: • With large transition payments • Offer to assume collection costs • Federal Conservative lost 1993 electionmassively • BC voterscurrentlyseeking a referendum to overturn HST
The basic architecture • Federalgoods and services taxacross Canada • Five provinces now have provincial taxwhichisbased on federal GST and administered by federalgovernment (Harmonized Sales Tax) • Quebec has Quebec Sales Tax, whichiscloselymodelled on federal GST, and itadministersfederal GST • Provinces essentially must use federal base, but have some liberty to vary rate • Revenues are distributed on a deemed destination basis
Comparison of Some Key Features of Canada’s Subnational VAT Regimes
The Federal GST • Wasintended to be revenue neutral, withbroad base includingmost services and housing and direct imports by consumers. Initial rate 7%; now 5% • Difficultpoliticsled to exclusion of “basic groceries” at last minute. Also a targetted refundable income tax credit was designed to deal with distributional issue • Uses rebates for VAT relief: about 14 categories including MASH, charities, housing—different rates • Huge effort during transition to explain tax to VAT registrants • Efficient system of input credits, e.g. in 2003 $144B on sales with $130B claimed as credits for net $14B revenue. • Non-compliance estimated at 4% • Demonstrates that a federal VAT can exist alongside provincial sales taxes
The Harmonized Sales Tax • Original threeagreed on rate of 8%, but now BC is 7% and Ontario 8%. Atlantic provinces agreedtheyneededunanimity to lower rate and 2 out of 3 to raiseit. Ontario and BC are free on rate, withadequate notice • While all provinces must use federal base, the effective rates of taxvarybecause of differentrebateschemes. Federal-provincial agreementslimitextent of rebates. • Unlikefederal GST, prime criterion for services at provincial level is “place of performance” not location of final consumption, so provincial tax on interprovincial services is largely on origin, not destination basis. However, credits generated against such HST may be offset against GST, so in this sense it is a national scheme
Allocating HST Revenue • System is not based on tracking of the revenue collected in anyparticular province • Payments in any given year are based on a projection of revenues, allocated using the shares of two years previous. A province’s revenue isbased on a formula thatappliesitsshare of the total GST taxable base to itstax rate. Taxes paid by federal and HST provincial departments are excludedfrom the pool as are specifiedrefunds and rebates. • No allowance for unpaid GST or any revenue afterclosing date for adjustments. The federalgovernmentkeepssuch gains, but must “eat” unpaid GST ($1.3B in 2006) • There is detailed calculation of the revenue pool, e.g. 130 categories of consumption expenditure, GST border collections, rebates to public agencies etc.
The Quebec Sales Tax • QST destination-based, credit-invoice VAT at rate of 8.5%, applied on GST inclusive price (tax on tax) • Base has becomelargelyidentical to GST, but large businesses are deniedsome input taxrefunds. Export of goods and services are zero-rated (withminor exceptions). QST rebate rates are lowerthan GST rebate rates. • Both GST and QST apply to foreign imports, while QST applies to domestic imports for registered QST payers on a self-assessment basis for others—but not if theywould have been eligible for an input taxrefund • Quebecreceives a fee for collecting GST for federalgovernment. It has an incentive to enforceitwellbecause the QST base growswith GST collections. Evasionestimatedat 8%
Economiceffects of HST reform • Variousestimates. National consumer prices permanent rise of 0.4% from Ontario and BC reforms (50% of economy). Consumer spendinglikely not to varybecause of othertax offsets. Total tax packages are mildlyredistributive in favour of lowincomes (gain) relative to highincomes (loss). Expectimmediate 10-15% annualizedincrease in business investment in machinery and equipment. • A study in British Columbia estimated gains over tenyears of $11.5B in capital investment and 113,000 jobs. The marginal effective tax rate on capital for large businesses will drop from 29.5% to 21.5%--and be more thanhalved for small business (to 9%)
SomeConcluding Observations • Canadian experiencewith a dual VAT regime has been successful and iseconomicallysuperior to retail sales taxregimes. Proves an invoice-credit destination-based VAT canworkat the sub-national level • Both the HST and the QST modelsfunctionwell. A single national administration has compliancecostadvantages, but devolved administration canwork, perhapsespeciallywithonly one opt out. Intergovernmentalcooperationis essential. • The dual system preserves provincial autonomy over rates, but dependsheavily on a shared base, withlimitedspecialrebates etc. • Federalinvolvementiscritical. For establishing the base. For border collection. And for facilitating provinces taxing theirownresidentseffectivelygiven extensive inter-provincialtrade.