Download
1 / 10
110 likes | 246 Views
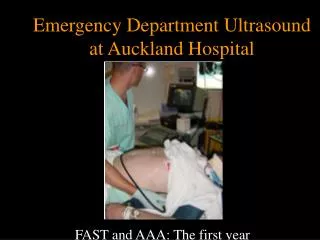
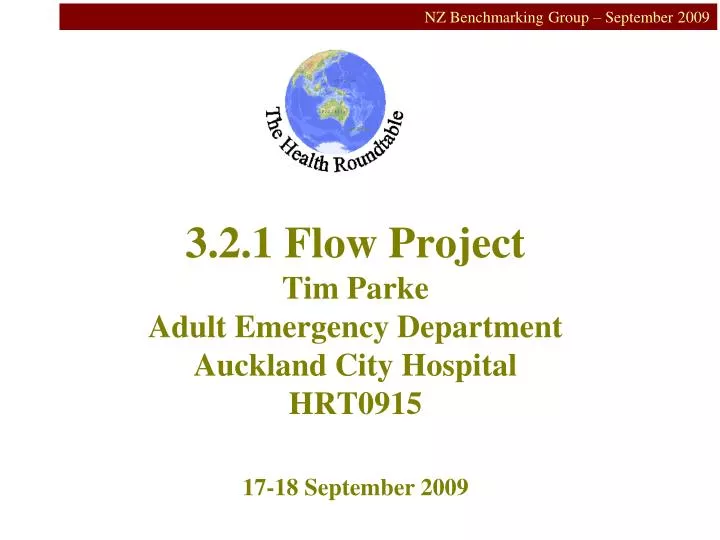
3.2.1 Flow Project Tim Parke Adult Emergency Department Auckland City Hospital HRT0915. 17-18 September 2009. Background. Robust systems New purpose built department 3 streams at front door: CED, APU, AED (84,000 pa) Strictly enforced “no ED corridor” policy Code Purple for gridlock

E N D
3.2.1 Flow ProjectTim ParkeAdult Emergency DepartmentAuckland City HospitalHRT0915 17-18 September 2009
Background • Robust systems • New purpose built department • 3 streams at front door: CED, APU, AED (84,000 pa) • Strictly enforced “no ED corridor” policy • Code Purple for gridlock • ED “House Rules” for doctors • Minimal “primary care” patients
Waste 40% AED resources used for non ED care Estimated 5,600 wasted IP days ED length of stay average >6 hours KEY PROBLEM = GRIDLOCK
KEY PROBLEM = GRIDLOCK • Poor Care • Estimated 34 additional IP deaths per year • Multiple complaints and adverse events • Long triage waits for T3,4
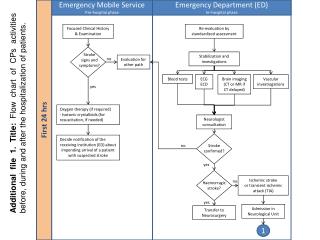
General M 7389 38.9% Cardio 1719 9.0% Orth Surg 2179 11.5% ENT 1619 8.5% Gen Surg 1924 10.1% Other 4176 22.0% ADHB AED High-level process map. Data for 2008 calendar year Walk-in 24079 55.3% 3322 7.6% APU 5522 12.6% Ambulance 18955 43.5% Discharge Other 544 1.2% Note: A further 12000 patients are assessed in APU Bed Request 2200 5.0% 7080 16.3% Ward Admission Patient presentations Initial Assessment Inpatient Specialist Team 1900643.6% 43578 100% 9582 22.0% No Bed Request 2502 5.7% ADHB 34453 79.1% Triage 1 936 2.2% Waitemata 4731 10.9% Triage 2 8510 19.7% 11782 27.0% Counties M 2331 5.3% Triage 3 15065 35% Discharge 3902 9.0% Other 2063 4.7% Triage 4 16564 384% Discharge Triage 5 2016 4.7% 2457256.4% 6 3 2 1 = + +
Focus of Further Evaluation • 3,2,1 compliance (admitted patients) • 3 hour = 70% • 2 hour = 50% • 1 hour = 6% • “Dead Time” (wasteful / dangerous) • Waiting to see specialist registrar prior to admission (within 2 hour target) • Waiting for bed after “Decision to Admit” (the 1 hour target)
Interactions with Specialty teams • ED side • Proper timely referral (senior review) • Appropriate investigations done (radiology) • Ensure whiteboard handover (>90%) • Specialty side • Response times by service / individuals • Avoidance of repeat documentation • Ensure whiteboard sign in (60 – 70%)
AED Discharges (Jan-Jun 2009) % Admitted within 1 Hr & Median Time Other 1% APU 12% Admitted With CHIPs Bed Request 16% Discharged 65% Admitted w/o Bed Request 6% Note: 22,798 total AED discharges in period considered
Current state Change Possible Result Preferred Result Waiting in ED Total occupancy 98% Waiting in ED Total occupancy 98% Reduced ED occupancy Waiting in ED Total occupancy 90% Electives Electives Electives • Decrease • Ward • Occupancy • Improved Discharge Processes • Decrease Unnecessary Patients In wards In wards In wards To be discharged To be discharged To be discharged Reduced Ward occupancy Currently, elective volumes are significantly impacted by ED volumes. Reduction in Ward Occupancy consumed by increased Elective Admissions No change in ED Wait Times Elective Volumes Maintained from Current State ED wait volumes and overall occupancy rate reduced