Download
1 / 42
460 likes | 956 Views
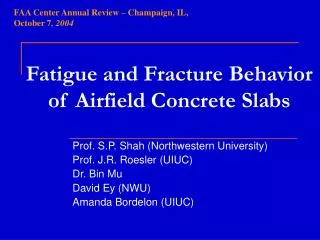
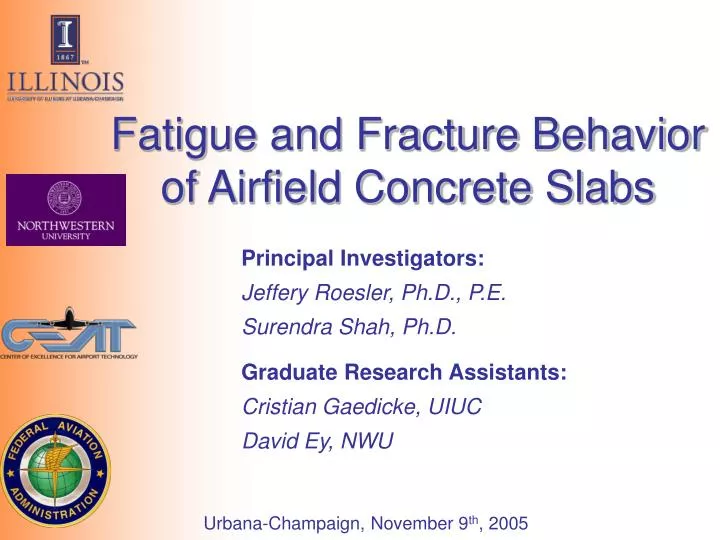
Fatigue and Fracture Behavior of Airfield Concrete Slabs. Principal Investigators: Jeffery Roesler, Ph.D., P.E. Surendra Shah, Ph.D. Graduate Research Assistants: Cristian Gaedicke, UIUC David Ey, NWU. Urbana-Champaign, November 9 th , 2005. Outline. Objectives Experimental Design

E N D
Fatigue and Fracture Behavior of Airfield Concrete Slabs Principal Investigators: Jeffery Roesler, Ph.D., P.E. Surendra Shah, Ph.D. Graduate Research Assistants: Cristian Gaedicke, UIUC David Ey, NWU Urbana-Champaign, November 9th, 2005
Outline • Objectives • Experimental Design • Experimental Results • 2-D Fatigue Model • Finite Element Analysis • Application of FEM Model • Fatigue Model Calibration • Fatigue Model Application • Summary • The Future Cohesive Zone Model
Load CMOD Research Objectives Predicting crack propagation and failure under monotonic and fatigue loading • Can fracture behavior from small specimens predict crack propagation on slabs. Three point bending beam (TPB) Beam on elastic foundation Slab on elastic foundation
Research Objectives • Integrate full-scale experimental slab data and a 2-D analytical fracture model (Kolluru, Popovics and Shah) • Check if the monotonic slab failure envelope controls the fatigue cracking life of slabs as in small scale test configuration. 2-D Model Fatigue load Monotonic load
Experimental Design • Beam Tests • Simple supported beams: • 2 beams, 1100 x 80 x 250 mm. • 2 beams, 700 x 80 x 150 mm. • 2 beams, 350 x 80 x 63 mm. • The beams have a notch in the middle whose length is 1/3 of the beam depth. • Beams on clay subgrade: • 2 beams, 1200 x 80 x 250 mm. • 2 beams, 800 x 80 x 150 mm. • 2 beams, 400 x 80 x 63 mm. • The beams have a notch in the middle whose length is 1/3 of the beam depth.
Experimental Design • Slab Tests • Large-scale concrete slabs on clay subgrade: • 2 slabs, 2010 x 2010 x 64 mm. • 4 slabs, 2130 x 2130 x 150 mm. • The load was applied on the edge through an 200 x 200 mm. steel plate. • The subgrade was a layer of low-plasticity clay with a thickness of 200 mm. • Concrete Mix • Standard PavingConcrete: ¾” limestone coarse crushed aggregate, 100 mm slump and Modulus of Rupture 650 psi at 28 days
Compliance vs. load cycle Experimental Results • Results on Beams • Monotonic Load • Full Load-CMOD curve. • Peak Load. • Critical Stress Intensity Factor (KIC) . • Critical CTOD (CTODc). • Compliance for each load Cycle (Ci).
Beam FEM Setup Small Beam
Monotonic Results and Crack Length From FEM From Testing
Experimental Results • Results on Beams • Fatigue Load in FSB • Load vs. CMOD curves • Compliance vs. number of cycles • Peak Load. • Stress Intensity Factor (KI) . • Compliance for each load Cycle (Ci).
≈ 5 mm Experimental Results • Results on Slabs • Monotonic Load • Full Load-CMOD curve. • Peak Load. • Compliance for each load Cycle (Ci).
Experimental Results • Results on Slabs • Fatigue Load • Load vs. CMOD curves • Compliance vs. number of cycles • Peak Load. • Stress Intensity Factor (KI) . • Compliance for each load Cycle (Ci).
2-D Fatigue Model w P P *C(loop) a *Ci t Pc Pmax s Ci ½ Pc Cu(1) Cu(2) Cu(3) Pmin CMOD CMOD *Secant compliance P Pc P P Pmax B Pc Pc A C Pmax Pmin O O D aeff a0 a\failure O’ O’ aeff a0 a\failure aeff a0 • 2-D Fatigue Model (Kolluru, Popovics and Shah, 2000) • Monotonic Test of TPB • Fatigue Test of TPB Relation between load and effective crack length aeff is obtained !!
2-D Fatigue Model a\crit a\failure Log(Da/DN) -3 C -5 O D -7 a B P C a\failure a a0 a\failure a\crit B Pc A C Pmax B a\crit O D a0 Nf 0.4Nf # cycles O’ a a0 • 2-D Fatigue Model • O’-O: no crack growth, linear part of the load-CMOD curve. • O-B: Crack Deceleration Stage, Stable crack growth, nonlinear part of the load-CMOD curve until peak load. • B-D: Crack Acceleration Stage • Post peak load-CMOD. Where: C1, n1, C2, n2 are constants Da = incremental crack growth between DN DN= incremental number of cycles DKI=stress intensity factor amplitude of a load cycle
Finite Element Analysis • FEM Mesh • Computation of the Stress Intensity Factor & Ci(a) An indirect method was used to calculate KI, called “Modified Crack Closure Integral Method. (Rybicki and Kanninen, 1977)
Finite Element Analysis • Relation between Crack length, Compliance and CMOD • Normal equations for TPB Beams are not applicable. FEM Modelation is required. • CMOD vs. Crack Length • Compliance vs. Crack Length The CMOD increases its value with the increase of the Crack Length. The normalized compliance at the midslab edge predicted using the FEM model shows a quadratic behavior.
Finite Element Analysis • Relation between Stress Intensity Factor and Crack Length • Relation between CMOD and Crack Length
Application of FEM Model • Step 1: Experimental Relation between CMOD and the Displacement • Experimental relation between CMOD measurements and displacement.
Application of FEM Model • Step 2: Determination of the Load vs. CMOD curves • The relation between CMOD and displace- ments allows to estimate the CMOD for the unnotched specimen
Application of FEM Model • Step 3: Estimation of the Crack Length • The crack length is estimated using this modified equation from the FEM model and the CMOD
Application of FEM Model • Step 4: Estimation of the Normalized Compliance (FEM) • The normalized compliance obtained from the FEM Model for different crack length is multiplied by the experimental initial compliance
Application of FEM Model • Step 5: Experimental Compliance vs. Crack Length curves
Fatigue Model Calibration • Step 1: The Compliance is measured for each fatigue load cycle of slab T2
Fatigue Model Calibration • Step 2: The Crack length is obtained for each cycle using the FEM Model for slab T2.
Fatigue Model Calibration acrit = 41 mm Ncrit = 25000 • Step 3: The Critical Crack acrit is Critical Number of Cycles Ncrit is obtained for slab T2. • This point of critical crack length is a point of inflexion in the curve
Fatigue Model Calibration acrit = 41 mm • Step 4: The two sections of the model are calibrated Different fatigue equations apply for crack length bigger or smaller than acrit • Log C1 = 17.6 • Log C2 = -15.0
Fatigue Model Application • Estimation of N1 • N1 is he required number of cycles to achieve acrit • This fatigue equation allows to predict crack propagation for any number of cycles N<N1 • If we have an unnotched slab, a0 = 0 • Log C1 = 17.6
Fatigue Model Application • Estimation of N2 • N2 is he required number of cycles to achieve afailure • This fatigue equation allows to predict crack propagation for any number of cycles N1<N<N2 • Log C2 = -15.0
Summary Currently, empirical fatigue curves don't consider crack propagation. Fracture mechanics approach has clear advantages to predict crack propagation. Monotonic tests are failure envelope for fatigue. Mechanics of model work but model coefficients need to be improved. A Cohesive Zone Model has greater potential to give a more conceptual and accurate solution to cracking in concrete pavements
Tasks Remaining • Fatigue crack growth prediction of beams on elastic foundation (NWU) • Complete model calibration on remaining slabs • Several load (stress) ratios • Tridem vs. single pulse crack growth rates • Write final report
Current Model Limitations • Crack propagation assumed to be full-depth crack across slab • pre-defined crack shape • Need geometric correction factors for all expected slab sizes, configurations, support conditions • Need further validation/calibration with other materials and load levels
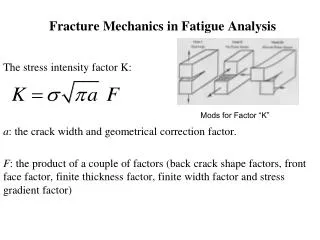
Fracture Mechanics Size Effect • Size Effect Method (SEM) • Two-Parameter Fracture Model (TPFM) • Equivalent elastic crack model • Two size-independent fracture parameters : KI and CTODc Strength Theory • Energy concept • Equivalent elastic crack model • Two size-independent fracture parameters: Gf and cf Quasi-brittle LEFM Bazant ZP, Kazemi MT. 1990, Determination of fracture energy, process zone length and brittleness number from size effect, with application to rock and concrete, International Journal of Fracture, 44, 111-131. Jenq, Y. and Shah, S.P. 1985, Two parameter fracture model for concrete, Journal of Engineering Mechanics, 111, 1227-1241.
Traction-free macrocrack Bridging zone Microcrack zone What is the Cohesive Zone Model? • Modeling approach that defines cohesive stresses around the tip of a crack • Cohesive stresses are related to the crack opening width (w) • Crack will propagate, when s = ft
How can it be applied to rigid pavements? • The cohesive stresses are defined by a cohesive law that can be calculated for a given concrete • Concrete properties • Cohesive law Cohesive Elements • Cohesive Finite Element • Cohesive Elements are located in Slab FEM model
Why is CZM better for fracture? • The potential to predict slab behavior under monotonic and fatigue load • Cohesive laws • The cohesive relation is a MATERIAL PROPERTY • Predict fatigue using a cohesive relation that is sensitive to applied cycles, overloads, stress ratio, load history. • Allows to simulate real loads Cohesive Elements • Cohesive Finite Element • Monotonic and Fatigue Slab behavior
Proposed Ideas • Laboratory Testing and Modeling of Separated (Unbonded) Concrete Overlays • Advanced Concrete Fracture Characterization and Modeling for Rigid Pavement Systems
Laboratory Testing and Modeling of Separated Concrete Overlays hol Concrete Overlay he Existing Concrete Pavement Bond Breaker - Asphalt Concrete Bond Breaker ~ 2”
New PCC New PCC AC Interlayer Old PCC AC Interlayer Old PCC Rigid Support Support Laboratory Testing and Modeling of Separated Concrete Overlays Cohesive elements
Advanced Concrete Fracture Characterization and Modeling for Rigid Pavement Systems • Concrete properties • Cohesive law Cohesive Elements • Cohesive Elements are located in Slab FEM model • Cohesive Finite Element