Download

1 / 17
170 likes | 273 Views
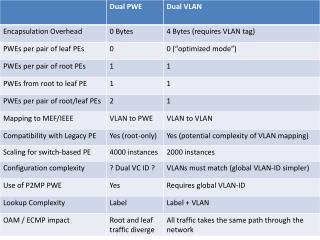
Modelling to address aquaculture issues David Greenberg DFO Bedford Institute of Oceanography Contact: david.greenberg@dfo-mpo.gc.ca. Southern Grand Manan. 2000 7 farms within 3 BMAs; ~1.79M fish odd year-classes (black); even year-classes (white) 2003

E N D
Modelling to address aquaculture issues David Greenberg DFO Bedford Institute of Oceanography Contact: david.greenberg@dfo-mpo.gc.ca
Southern Grand Manan • 2000 • 7 farms within 3 BMAs; ~1.79M fish • odd year-classes (black); even year-classes (white) 2003 • 5 new odd year-class farms authorised (hatched); • total of 12 farms ~3.69M fish • Concerns that the fish health management strategy may be ineffective due to uncertainties in the knowledge concerning: • water exchange between sites • effectiveness of the existing BMA boundaries
Site 303’s Buffer Zone or Zone of Influence encompasses 7 sites - 0 in BMA 19 4 in BMA 20 3 in BMA 21 Simple Approach: 5 km radius “buffer” zones • Determined each farm’s buffer zone overlap • with other farms • with other buffer zones • Used GIS software (MapInfo)
Model-derived particle tracks over 1 tidal cycle i.e. tidal excursions • Released 36 “drogues” evenly spaced on a 200 m 200 m grid centred on each farm site • Drogues released from each point at 1 hour intervals for 12 hours • Each drogue followed for at least one tidal cycle (12.42 h) • Tidal excursion estimated as area covered by all drogue tracks during 1 tidal cycle • Excursion not a circle and covers less area than circle Particle release grid 5 km radius ZPI Particle trajectories Farm sites
Model-derived tidal excursions for all fish farms (1 tidal cycle)
Applications – WebDrogue, Aquaculture parasites and disease, SAR, IBMs, dead whales ... - may mimic concentration applications – sediment, oils spills Use and derive statistical properties Fourth order Runge-Kutta with 5th order correction We assume we have the fields we need – Z, U, V, T, S …, - can be extremely complex • Some Issues • Random numbers • Interpolation - time and space • Non convergent fields • How many particles • Under sampling
DFO Website Application of a nested-grid ocean circulation model to Lunenburg Bay of Nova Scotia: Verification against observations Li Zhai, Jinyu Sheng and Richard J. Greatbatch, J. Geophys. Res., 113, C02024, doi:10.1029/2007JC004230
Lagrangian Stochastic Modeling in Coastal Oceanography, DAVID BRICKMAN AND P. C. SMITH, J. Atmos. Ocean. Tech., 19:83-99, 2002. Under-sampling: Inhomogeneous diffusion:
Per-step displacement A hierarchy of Lagrangian Stochastic Models: AR0, AR1, AR2 (... ARn) AR0 Uncorrelated random walk and simple diffusion = = 0 AR1 Autocorrelated Velocity = 0 AR1 AR2 Autocorrelated acceleration AR0 , ≠ 0
Lagrangian Dispersion in Sheared Flow, D.R. Lynch and K.W. Smith, Contin. Shelf Res.,30:2092-2105, 2010.
Keith R. Thompson, Michael Dowd, Yingshuo Shen, David A. Greenberg, Probabilistic characterization of tidal mixing in a coastal embayment: a Markov Chain approach, Continental Shelf Research 22 (2002) 1603–1614
Probability a particle stays in the region in which it was released as a function of time. Probability that a particle moves from Ri to Rj in k tidal cycles or less.
Susan Haigh, St. Andrews Biological Station FVCOM See: Suh, Seung-Won, A hybrid approach to particle tracking and Eulerian–Lagrangian models in the simulation of coastal dispersion, Environmental Modelling & Software 21 (2006) 234–242
David I. Graham, Rana A. Moyeed, Powder Technology 125 (2002) 179– 186 How many particles for my Lagrangian simulations? ‘What is a “statistically significant” sample of particles to determine particle statistics such as concentrations, fluxes, dispersivities or root mean square velocities? Different samples of the same number of (physically identical) particles will produce different results. “This means that Lagrangian modellers are experimentalists rather than theoreticians.” Findings 1. In order to characterize the variability of computed results, computations must be repeated (>1 times); 2. The variability depends on the quantity in question as well as the location in the flow; 3. For any given point and for a given quantity, the standard deviation s of the quantity is initially low and then increases, but eventually decreases like sqrt(number of points) ...
Continued David I. Graham, Rana A. Moyeed, Powder Technology 125 (2002) 179– 186 How many particles for my Lagrangian simulations? Method 1. Select a region of interest in the flow. 2. Decide the levels of precision required for each quantity. 3. Decide on the number of repetitions (Nr) required (50 appears reasonable, but the larger, the better subject to storage constraints—remember that the variability is determined by the product of the number of particles Np with the number of repetitions Nr); 4. Perform repeated calculations with ‘small’ numbers of particles (100, 200, 500, 1000, 2000. . . ), calculate variability, and ensure that the largest numbers of particles used are sufficient for the variability to be proportional to sqrt(Np). 5. Using the results from part 4, extrapolate down to the required level of accuracy (i.e., determine the number of particles No that would ensure variability within the prescribed limits). 6. Perform Nr calculations with No particles, determine means and confidence limits (error bars), and display results.
Parting shots Simulating particles in model fields may not be simple “This means that Lagrangian modellers are experimentalists rather than theoreticians.” Graham and Moyeed (2002)
Particles in Motion Pathways in the Coastal Ocean Daniel R. Lynch Dartmouth College, Hanover, NH, USA David A. Greenberg Fisheries and Oceans, Bedford Institute of Oceanography, NS, Canada Ata Bilgili Istanbul Technical University, Istanbul, Turkey