Download
1 / 17
170 likes | 278 Views
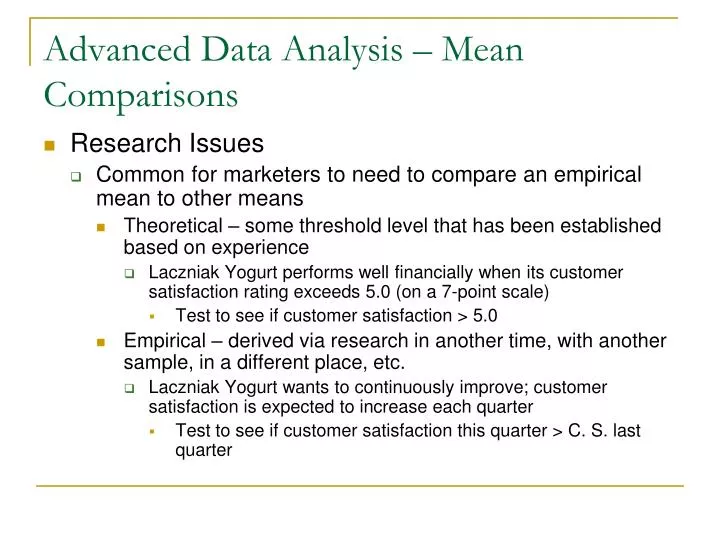
Advanced Data Analysis – Mean Comparisons. Research Issues Common for marketers to need to compare an empirical mean to other means Theoretical – some threshold level that has been established based on experience

E N D
Advanced Data Analysis – Mean Comparisons • Research Issues • Common for marketers to need to compare an empirical mean to other means • Theoretical – some threshold level that has been established based on experience • Laczniak Yogurt performs well financially when its customer satisfaction rating exceeds 5.0 (on a 7-point scale) • Test to see if customer satisfaction > 5.0 • Empirical – derived via research in another time, with another sample, in a different place, etc. • Laczniak Yogurt wants to continuously improve; customer satisfaction is expected to increase each quarter • Test to see if customer satisfaction this quarter > C. S. last quarter
Advanced Data Analysis – Mean Comparisons • Research Issues • Common for marketers to need to compare an empirical percentage to other percentages • Laczniak Yogurt will only introduce new flavors if they are deemed to be “acceptable” by 20% of its customers in a test market • Test to see if Acceptance > 20% • Such issues lend themselves to a specific set of analysis procedures which involve classical hypothesis testing procedures
Advanced Data Analysis – Mean Comparisons • Hypothesis Test Procedures • State Null and alternative hypotheses (Null always means no relationship – reject it if you can) • Specify the level of statistical significance (a) • This is 1 - Confidence Interval • According to the AMA • .05 (in Marketing Research) • Specify the critical region to be used • Determine the critical value of the key statistic (t) • Collect data and determine test statistic (computed t) • Test hypothesis • Reject or retain the null hypothesis
Advanced Data Analysis – Mean Comparisons • t-test • Used to test hypotheses that a mean is greater (less) than or equal to some theoretical value • Laczniak Yogurt is test marketing new flavor (grape). History tells them that the new flavor will be successful if they sell, on average, more than 100 cartons in one month in each of the test markets.
Advanced Data Analysis – Mean Comparisons • Steps in Hypothesis Testing • State Null and alternative hypotheses (Null always means no relationship – reject it if you can) • Ho: m≤ 100 • Ha: m>100 • Specify the level of statistical significance (a) • .05, obviously • Specify the critical region to be used (Table 4 – P. 828) • Critical t (df = n-1 =10-1=9) = 1.83
Advanced Data Analysis – Mean Comparisons • Collect data and determine test statistic • For example • n = 10 (with SRS) • mean = 109.4 • s = 14.40 • Test hypothesis -- reject or retain the null hypothesis • Compute t • Where t = computed mean – m/ √n • 109.4 – 100/(14.4/√10) • Computed t = 2.07 • Computed t ≥(?) Critical t • 2.07 ≥ 1.83 -- Reject the null hypothesis
Advanced Data Analysis – Mean Comparisons • What if: • n = 10 (with SRS) • Mean = 103.4 • s = 10.0 • n = 50 (with SRS) • Mean = 103.4 • s = 10.0 • Importance of n and s
Advanced Data Analysis – Mean Comparisons • Hypothesis Tests • t-test • Used to test hypotheses that a mean is greater (less) than or equal to a different empirically derived value • For example, test the hypothesis is Mean1 > Mean 2
Advanced Data Analysis – Mean Comparisons • Laczniak Yogurt Company is interested in using a new container design for its product. Two alternative designs (one red, the other orange) were chosen to test in 20 stores (ten for each design) in Iowa. Laczniak management wants to use the design that lead to the highest sales level in the test markets. Data for the stores are:
Advanced Data Analysis – Mean Comparisons • Here is a summary of the data: • Red • Mean = 403 • s = 20.76 • Orange • Mean = 390.3 • s = 15.26 • State Null and alternative hypotheses • Ho: m1m2 • Ha: m1>m2 • Compute t statistic (t = 1.56); critical t (df = n1 + n2 – 2) • Critical t = 1.73 • Test If |Computed t| ≥ critical • Is 1.56 ≥ 1.73? • NO -- CANNOT REJECT THE NULL
Advanced Data Analysis – Mean Comparisons • What if the mean and standard deviation remained constant and the sample size for both containers were 25? • What if the means remained the same and s for both containers was 10.00 (n = 10)?
Advanced Data Analysis – Mean Comparisons • Research Issues • Common for marketers to need to compare an empirical percentage to a theoretical percentage (or standard) • Laczniak Yogurt will only introduce new flavors if they are deemed to be “acceptable” by more than 20% of its customers in a test market • Assume that Laczniak attempted to introduce a new plum flavored yogurt • Had a sample of 625 randomly selected customers who participated in the test market – 140 indicated that they would buy the new flavor
Advanced Data Analysis – Mean Comparisons • Steps in Hypothesis Testing • State Null and alternative hypotheses (Null always means no relationship – reject it if you can) • Ho: ≤ .20 • Ha: > 20 • Specify the level of statistical significance (a) • .05, obviously • Compute test statistic and test hypothesis • z-statistic = p - /sp; where sp = √ (1 - )/ n
Advanced Data Analysis – Mean Comparisons • Collect data and determine test statistic • For example • n = 625 (with SRS) • p = 140/625 = .23 • sp = √ .2 (.8)/625 = .016 • Test hypothesis -- reject or retain the null hypothesis • Compute z • Where z = p - /sp • .23 – .20/.016 • Computed z = 1.88 • Computed z ≥ Critical z (1.645 for alpha = .05) • 1.88 ≥ 1.645 • Reject the null hypothesis
Advanced Data Analysis – Mean Comparisons • What if the same data were generated, but the sample size was 225?