Download
1 / 39
390 likes | 396 Views
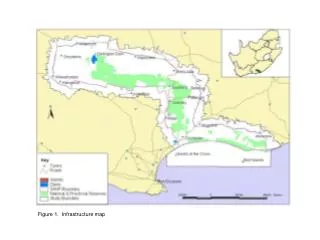
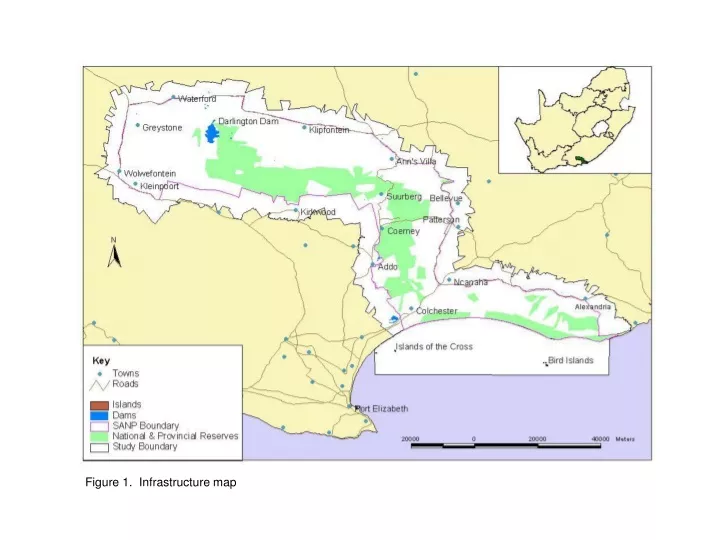
Figure 1. Infrastructure map. Figure 2. Upland-lowland interfaces. Figure 3. Biome interfaces. Figure 4. Thicket interfaces. Figure 5. Riverine corridors linking inland and coastal biotas. Figure 6. Riverine corridors through mountainous terrain.

E N D
Figure 5. Riverine corridors linking inland and coastal biotas
Figure 7. Algoa dunefield with 500 m buffered inland boundary
Figure 8: Algoa dunefield with 2000 m buffered inland boundary
Figure 9. Rainfall gradients as drought refuges in drought-prone habitat
Figure 10. All ecological and evolutionary processes combined
Natural Grazed Agriculture Settlement Natural Estuary Figure 11. Current Land use in the planning domain
High density Medium density Low density GAENP Boundary Figure 12. The current extent of alien invasive plants
Darlington Dam Future threat weightings Medium High Figure 14. Composite threat weighting for each land class
Darlington Dam Threat weightings Low Medium High Figure 15. The distribution of grazing threats in the landscape
Darlington Dam Threat weightings Low Medium High Figure 16. The distribution of cultivation threats in the landscape
Darlington Dam Threat weightings Low Medium High Figure 17. The distribution of potential human settlement-related disturbance in the landscape
Darlington Dam Threat weightings Low Medium High Figure 18. The distribution of potential alien threats in the landscape
Figure 19. The percentage of intact area required by each landclass to meet its’ overall target
Figure 20 The extent of transformation of the spatially defined landscape processes in the GAENP planning domain
Figure 21. The existing reserve system (both statutory and non-statutory) and land earmarked for purchase within the GAENP planning domain. (Numbers on the map are referred to in the text.)
Figure 22. Effectiveness of the existing and earmarked reserve system for the protection of primary level land classes.
Figure 23 Effectiveness of the existing and earmarked reserve system for the protection of secondary level land classes.
Figure 24 Effectiveness of the existing and earmarked reserve system for the protection of larger mammals.
Figure 25. Effectiveness of the existing and earmarked reserve system for the protection of landscape level processes.
Figure 26 The distribution of upland-lowland and biome interfaces in relation to the existing and earmarked reserve system. Numbers on the map are referred to in the text.
Figure 27. The distribution of thicket interfaces in relation to the existing and earmarked reserve system. Numbers on the map are referred to in the text.
Figure 28. The distribution of north-south and east-west riverine corridors in relation to the existing and earmarked reserve system. Numbers on the map are referred to in the text.
Figure 29. The distribution of sand-movement corridors in relation to the existing and earmarked reserve system. Numbers on the map are referred to in the text.
Figure 30. The distribution of drought refuge rainfall gradients in relation to the existing and earmarked reserve system. Numbers on the map are referred to in the text.
Figure 31. Patterns of irreplaceability for achieving land class targets in the GAENP planning domain
Figure 32. Patterns of irreplaceability for achieving mammals targets in the GAENP planning domain
Figure 33. Patterns of irreplaceability for achieving process targets in the GAENP planning domain
Figure 34. Patterns of irreplaceability across the GAENP planning domain after the selection of statutory reserves (Step 1).
Figure 35. Patterns of irreplaceability across the GAENP planning domain after the selection of farm properties containing processes (Step 2).
Figure 36. Patterns of irreplaceability across the GAENP planning domain after the selection of rivers and the GAENP-MPA (Steps 3 and 4).
Figure 37. The notional conservation system for the GAENP planning domain derived from the set of criteria followed in Steps 1-6.
Figure 38. Irreplaceability-vulnerability graph used to derive implementation priority.
Figure 39. Map showing implementation priorities within the GAENP planning domain.