Download
1 / 9
90 likes | 90 Views
A summary of the costs and efficiencies of major banks in processing OTC derivatives transactions in various product categories. Highlights year-on-year trends, economies of scale, and operational performance.

E N D
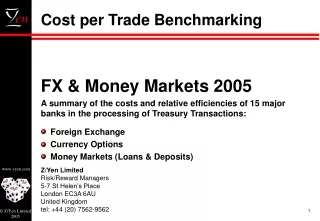
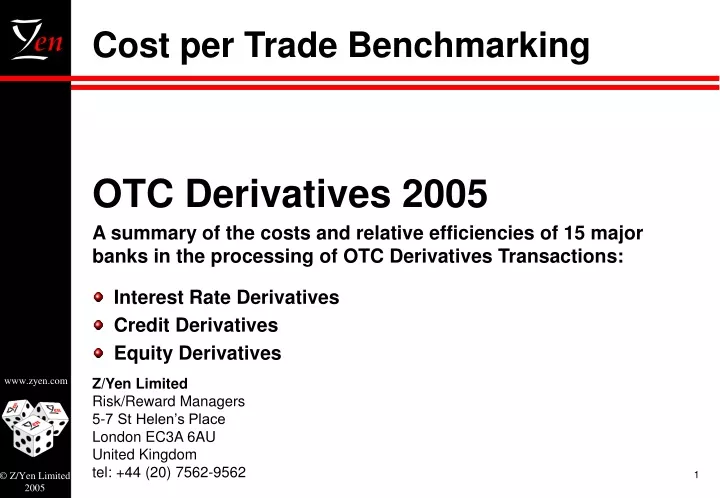
Cost per Trade Benchmarking OTC Derivatives 2005 A summary of the costs and relative efficiencies of 15 major banks in the processing of OTC Derivatives Transactions: Interest Rate Derivatives Credit Derivatives Equity Derivatives
Key 2005 Findings • The rise in trade volume for Equity and Credit Derivatives has led to big reductions in the Cost per Trade. However, processing costs for more traditional products, such as Interest Rate Derivatives, have remained static. • For Credit Derivatives, the Cost per Trade reduced from $401 to $233; • For Equity Derivatives, the Cost per Trade reduced from $385 to $220. • However, for Interest Rate Derivatives, the trend was reversed with the Cost per Trade rising from $181 to $209. • At the same time, it is clear that demand for staff has increased and this has brought a significant rise in the Cost per Head. • The average fully loaded Operations Cost per Head has risen from $123,000 to $133,000 per annum. This is fairly consistent across all products, though there is a small premium for Credit Derivatives staff. • Within Operations, the confirmation process is still the highest area of cost, particularly for Interest Rate and Credit Derivatives with several banks spending over $100 on each trade against an average of $40 to $60.
Introduction and Survey Scope • Participants • 15 major Global/European Banks • Products • Interest Rate Derivatives • Credit Derivatives • Equity Derivatives • Functions and Activities • Costs – Operations, IT, CLS • Headcount at a detailed activity level • Trade Volumes • Key Benchmarks • Cost per Trade • Cost per Head • Operational Throughput (Trade Volume Processed per Head) • Economy of Scale (Cost per Trade Relative to Trade Volume) • Activity Costs
Cost per TradeYear on Year Trends • For Interest rate Derivatives, static volumes and the rise in the Cost per Head have contributed to a rise in the Cost per Trade • For Credit and Equity Derivatives, a rise in volume together with increased usage of industry utilities and better technology has driven a rise in Operational Throughput and thus a reduction in the Cost per Trade.
Economy of Scale TrendsCost per Trade against Volume • For Vanilla Equity Options, the graph above shows that significant economies of scale have been achieved by the higher volume banks. • For IR and Credit products, however, the slope of the curves is flatter indicating that smaller, treasury focused banks can be just as efficient as the major players.
Convergence of Processing Efficiency • In previous years, Vanilla Interest Rate products have always been processed at a far higher Operational Throughput than other 'flow' products. • However, in 2004 the pattern changed with both Credit Default Swaps and Vanilla Equity Options being processed with vastly increased Operational Throughput. • In 2004, the trade volume processed per head was actually higher for Equity Options than Interest Rate Swaps.
Operations IT Support Costs • IT Support costs per trade have fallen across all products between 2003 and 2004. This is despite the gains in efficiency achieved by the corresponding Operations groups which are often attributed to IT improvements. • In a similar pattern to the Operations groups, unit costs for IT support have reduced most significantly for the Credit and Equity OTC products where volume growth has been the highest.
European Securities Global FX/MM Global OTC Derivatives US Securities Z/Yen - 2005 ProjectsConfirmed/Planned • Commodities • Corporate Loans • IM Admin. Costs • IM Operational Performance • Cost per Trade Benchmarking • Operational Performance of Brokers • Operations Best Practice • Settlement and Custody Fees • Corporate Actions • Brokerage Costs • Relocation Analysis FX/MM Global Clients (2005/6) OTC Derivatives Global Clients Securities (Eq. / FI) European Clients US Clients Asian Clients
www.zyen.com Jeremy Smith Giles Wright James Pitcher