Download
1 / 10
100 likes | 224 Views
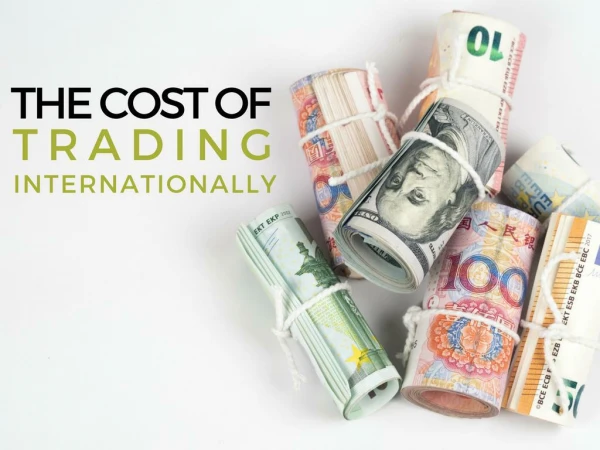
Cost per Trade Benchmarking. FX & Money Markets 2005 A summary of the costs and relative efficiencies of 15 major banks in the processing of Treasury Transactions: Foreign Exchange Currency Options Money Markets (Loans & Deposits). Key 2005 Findings.

E N D
Cost per Trade Benchmarking FX & Money Markets 2005 A summary of the costs and relative efficiencies of 15 major banks in the processing of Treasury Transactions: Foreign Exchange Currency Options Money Markets (Loans & Deposits)
Key 2005 Findings • The adoption of CLS by the major FX Trading banks has delivered not just the expected settlement risk reduction but also significant scalability in processing and a reduction in the Operations Cost per Trade. • 2004 was the first full year of CLS for the banks. For the year, on average, just under 50% of Interbank trades were settled through CLS although this ranged from 15% to 65% for individual banks. • One of the main benefits of CLS has been the ability to achieve volume scalability without the need for additional processing staff. • Usage of CLS, coupled with additional IT investments has meant that many banks INCREASED their FX volumes significantly between 2003-2004 with the same or LESS headcount. • Currency Option trade volume has increased significantly at major banks but the Cost per Trade has stayed flat and is still more than 4 times higher than Spot/Forward trades • Money Markets trade volume has increased in 2004 with a corresponding reduction in the Cost per Trade. The 2004 Cost per trade is now 50% of that in 2000.
Introduction and Survey Scope • Participants • 15 major Global/European Banks • Products • Foreign Exchange • Currency Options • Money Markets (Loans & Deposits) • Functions and Activities • Costs – Operations, IT, CLS • Headcount at a detailed activity level • Trade Volumes • Key Benchmarks • Cost per Trade • Cost per Head • Operational Throughput (Trade Volume Processed per Head) • Economy of Scale (Cost per Trade Relative to Trade Volume) • Activity Costs
Cost per TradeYear on Year Trends • For FX, the Cost per Trade has steadily decreased over the last 5 years despite some fluctuation in average volumes. In 2004, CLS completed its first full year of processing and this has further contributed to the ability of banks to 'scale up' their processing without a measurable increase in headcount. • For Currency Options, the Cost per Trade remained relatively static in 2004 despite another significant increase in average trade volume, part of this was due to the increase in the volume of corporate & exotic trades. • The Cost per Trade for Money Markets continues to reduce, indicating that technology improvements have been made in a previously "unfashionable" area.
Cost per TradeFX – Sub-Products • As can be seen opposite, the Operations Cost per Trade is significantly less for Interbank-CLS trades. • The Cost per Trade for Corporate-CLS trades is also lower (though this is based on very low volume) • Corporate Non-CLS trades are much more expensive to process – particularly confirmation production and chasing
Cost per HeadImpact of Location on the Cost per Head • Each year, the survey has shown that more and more processing headcount has been relocated to low cost locations, in particular India and other parts of South Asia. However, although the trend is towards such processing models, it has not been universally adopted by banks in this years survey. Only about a third of participating banks have significant headcount numbers 'offshore'. • The first obvious result of relocation has been a reduction in the average Cost per Head for FX processing. The two banks with the lowest Cost per Head both have significant headcount in offshore locations. However, having an offshore facility does not necessarily result in a lower Cost per Trade as a low Cost per Head is often complimented by low Operational Throughput (Trade volume processed per head).
Impact of CLS • This has been the first year that participants have been full members of CLS for an entire year. In terms of CLS 'take up', the % of trades processed through CLS is not specifically higher or lower for high or low volume banks. • Although the prime driver for CLS has been settlement risk reduction the survey does indicate that the Operations Cost per Trade (including IT) has been driven down by the introduction of CLS. • However, for Interbank Trades, when technology costs are excluded, there was very little difference in cost in 2004 between a) the operations cost of a CLS trade + the CLS fee and b) the operations cost of a non-CLS trade.
Scalability & Change in Headcount • One of the main benefits of CLS has been ability to allow scalability without the need for additional processing staff. CLS, coupled with additional IT investment has meant that many banks were able to increase their FX volumes between 2003-2004 with the same or LESS headcount. • Of the banks that participated in both this year's and last years survey with the same scope, only two showed an increase in headcount as their volumes also increased. • For Money Markets, there has not been any similar major change and the trend has been for the change in headcount to mirror the change in trade volume.
European Securities Global FX/MM Global OTC Derivatives US Securities Z/Yen - 2005 ProjectsConfirmed/Planned • Commodities • Corporate Loans • IM Admin. Costs • IM Operational Performance • Cost per Trade Benchmarking • Operational Performance of Brokers • Operations Best Practice • Settlement and Custody Fees • Corporate Actions • Brokerage Costs • Relocation Analysis FX/MM Global Clients (2005/6) OTC Derivatives Global Clients Securities (Eq. / FI) European Clients US Clients Asian Clients
www.zyen.com Jeremy Smith Giles Wright