Download

1 / 19
190 likes | 374 Views
The National Estuarine Eutrophication Assessment Update. S.B. Bricker NOAA, Silver Spring, MD. Tidal Monitoring and Analysis Workgroup January 5, 2006 Joe Macknis Memorial Conference Room , Annapolis , MD. http://ian.umces.edu/neea http://www.eutro.org. The Context and Guiding Legislation.

E N D
The National Estuarine Eutrophication Assessment Update S.B. Bricker NOAA, Silver Spring, MD Tidal Monitoring and Analysis Workgroup January 5, 2006 Joe Macknis Memorial Conference Room , Annapolis, MD http://ian.umces.edu/neeahttp://www.eutro.org
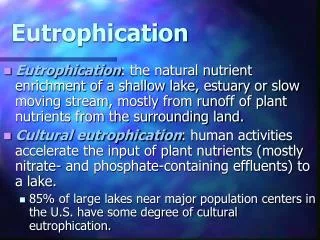
The Context and Guiding Legislation • US Clean Water Act of 1972, and US Harmful Algal Bloom and Hypoxia Research and Control Act of 1998, EU Water Framework Directive (2000/60/EC), EU UWWTD and Nitrates Directives – Definition of Sensitive Areas and Vulnerable Zones • Eutrophication is a process rather than a state • Elevated nutrient concentrations may or may not be associated to human loading • Eutrophication may or may not be associated to high nutrient loads or concentrations (e.g. Cloern, Howarth et al, Tett et al) • Eutrophication is a significant problem worldwide (US, EU, Baltic, Mediterranean, Japan, Australia and elsewhere)
Symptoms and Consequences of Nutrient Enrichment Nutrient Inputs Primary Secondary Consequences and Processing Impacts Impacts of Symptoms High algal production Loss of water clarity Epiphyte problems Macroalgal problems Fish kills Loss of habitat Human health risks Loss of tourism Closed fishing grounds Increased N and P concentration Loss of SAV Low D.O Nuisance/Toxic blooms The Problem – The Assessment Approach NEEA/ASSETS: Pressure - State - Response P: Overall Human Influence (OHI) – Natural processing + Human Nutrient Load S: Overall Eutrophic Condition (OEC) – Condition of waterbody R: Determination of Future Outlook (DFO) – What will happen in the future? http://ian.umces.edu/neeahttp://www.eutro.org
Key Aspects of the NEEA approachOverall objective: to provide coastal managers with scientific information and tools needed to balance environmental, social, and economic goals. • The NEEA approach may be divided into three parts: • Division of estuaries into homogeneous areas • Evaluation of data completeness and reliability • Application of indices • Tidal freshwater (<0.5 psu) • Mixing zone (0.5-25 psu) • Seawater zone (>25 psu) Spatial and temporal quality of datasets (completeness) Confidence in results (sampling and analytical reliability) Overall Eutrophic Condition (OEC) index Overall Human Influence (OHI) index Determination of Future Outlook (DFO) index ASSETS Rating State Pressure (Response) P +S +R Bricker, Ferreira and Simas. 2003 Ecol. Model. 169: 39-60
Overall Human Influence Moderate High High Moderate Low Susceptibility Moderate Low Moderate High Moderate Moderate Moderate Low Low Low High High Moderate Low Nutrient Pressures Overall Human Influence (OHI) - Pressure Susceptibility + Nutrient Inputs = Overall Human Influence dilution & flushingland based or oceanic
Overall Human Influence (OHI) - Pressure • Calculate mh, the expected nutrient concentration due to land based sources (i.e. no ocean sources); • Calculate mb, the expected background nutrient concentration due to the ocean (i.e. no land-based sources); • Calculate OHI as the ratio of mh/(mh+mb); Class Thresholds Low 0 to <0.2 Moderate low 0.2 to <0.4 Moderate 0.4 to < 0.6 Moderate high 0.6 to < 0.8 High >0.8 Equations are based on a simple Vollenweider approach, modified to account for dispersive exchange: Ocean inputs Anthropogenic inputs Estuary Bricker, S.B., Ferreira, J.G. & Simas, T. 2003. An Integrated Methodology for Assessment of Estuarine Trophic Status. Ecological Modelling. 169:39-60.
Overall Eutrophic Condition (OEC) - State NEEA Methodology 1) Determine level of expression for Chl a, macroalgae, epiphytes, D.O., SAV loss and HABs for each zone (combines concentration/observance, spatial coverage, frequency of occurrence) by logic tree 2) Determine and overall estuary expression for primary (average symptom values) and secondary (highest symptom value) symptoms 3) Combine overall primary and secondary for overall estuary by matrix Level of expression detail: • Concentration Data: cumulative frequency (Chl a = 90th percentile; DO = 10th percentile) • Spatial area: determined by GIS or Grid
1 1 MODERATE HIGH MODERATE HIGH HIGH HIGH HIGH HIGH MODERATE MODERATE Primary symptoms high Primary symptoms high High primary and High primary and High primary and High primary and Primary symptoms high Primary symptoms high and substantial and substantial secondary symptom secondary symptom secondary symptom secondary symptom symptoms symptoms but problems with more but problems with more High primary High primary secondary symptoms secondary symptoms levels indicate serious levels indicate serious serious secondary serious secondary becoming more becoming more eutrophication eutrophication eutrophication eutrophication symptoms still not being symptoms still not being expressed, indicating expressed, indicating problems problems problems problems expressed expressed potentially serious potentially serious problems problems 0.6 0.6 MODERATE LOW MODERATE LOW MODERATE LOW MODERATE LOW HIGH HIGH HIGH HIGH Primary symptoms Primary symptoms Primary symptoms Primary symptoms Substantial levels of Substantial levels of Substantial levels of Substantial levels of MODERATE MODERATE beginning to indicate beginning to indicate beginning to indicate beginning to indicate eutrophic eutrophic eutrophic eutrophic conditions conditions conditions conditions Level of expression of Level of expression of symptoms symptoms Moderate primary Moderate primary possible problems possible problems possible problems possible problems occuring occuring occuring occuring with secondary with secondary with secondary with secondary eutrophic eutrophic conditions is conditions is but still very few but still very few but still very few but still very few symptoms indicating symptoms indicating symptoms indicating symptoms indicating substantial substantial secondary symptoms secondary symptoms secondary symptoms secondary symptoms serious problems serious problems serious problems serious problems expressed expressed expressed expressed 0.3 0.3 MODERATE HIGH MODERATE HIGH MODERATE HIGH MODERATE HIGH MODERATE HIGH MODERATE HIGH MODERATE LOW MODERATE LOW MODERATE LOW MODERATE LOW MODERATE LOW MODERATE LOW MODERATE LOW MODERATE LOW High secondary High secondary High secondary High secondary High secondary High secondary Moderate secondary Moderate secondary Moderate secondary Moderate secondary Moderate secondary Moderate secondary Moderate secondary Moderate secondary LOW LOW symptoms indicate symptoms indicate symptoms indicate symptoms indicate symptoms indicate symptoms indicate symptoms indicate symptoms indicate symptoms indicate symptoms indicate symptoms indicate symptoms indicate symptoms indicate symptoms indicate symptoms symptoms Low primary Low primary Level of expression of Level of expression of serious problems, but serious problems, but serious problems, but serious problems, but serious problems, but serious problems, but substantial substantial substantial substantial substantial substantial substantial substantial eutrophic eutrophic eutrophic eutrophic eutrophic eutrophic eutrophic eutrophic eutrophic eutrophic conditions is conditions is low primary indicates low primary indicates low primary indicates low primary indicates low primary indicates low primary indicates conditions, but low conditions, but low conditions, but low conditions, but low conditions, but low conditions, but low conditions, but low conditions, but low minimal minimal other factors may also other factors may also other factors may also other factors may also other factors may also other factors may also primary indicates other primary indicates other primary indicates other primary indicates other primary indicates other primary indicates other primary indicates other primary indicates other be involved in causing be involved in causing be involved in causing be involved in causing be involved in causing be involved in causing factors may be involved factors may be involved factors may be involved factors may be involved factors may be involved factors may be involved factors may be involved factors may be involved in causing the conditions in causing the conditions conditions conditions conditions 0 0 0.3 0.3 0.6 0.6 1 1 Low secondary Low secondary Moderate secondary Moderate secondary High secondary High secondary symptoms symptoms symptoms symptoms symptoms symptoms Matrix for Determining Overall Eutrophic Condition Overall level of expression of Overall level of expression of e e eutrophic conditions utrophic conditions 1 1 1 1 MODERATE HIGH MODERATE HIGH MODERATE HIGH MODERATE HIGH HIGH HIGH HIGH HIGH MODERATE MODERATE MODERATE MODERATE Primary symptoms high Primary symptoms high Primary symptoms high Primary symptoms high High primary and High primary and High primary and High primary and Primary symptoms high Primary symptoms high Primary symptoms high Primary symptoms high and substantial and substantial and substantial and substantial secondary symptom secondary symptom secondary symptom secondary symptom symptoms symptoms symptoms symptoms but problems with more but problems with more but problems with more but problems with more High primary High primary High primary High primary secondary symptoms secondary symptoms secondary symptoms secondary symptoms levels indicate serious levels indicate serious levels indicate serious levels indicate serious serious secondary serious secondary serious secondary serious secondary becoming more becoming more becoming more becoming more eutrophication eutrophication eutrophication eutrophication symptoms still not being symptoms still not being symptoms still not being symptoms still not being expressed, indicating expressed, indicating expressed, indicating expressed, indicating problems problems problems problems expressed expressed expressed expressed potentially serious potentially serious potentially serious potentially serious problems problems problems problems 0.6 0.6 0.6 0.6 MODERATE LOW MODERATE LOW HIGH HIGH HIGH HIGH Primary symptoms Primary symptoms Substantial levels of Substantial levels of Substantial levels of Substantial levels of MODERATE MODERATE MODERATE MODERATE beginning to indicate beginning to indicate eutrophic eutrophic eutrophic eutrophic conditions conditions conditions conditions Level of expression of Level of expression of Level of expression of Level of expression of symptoms symptoms symptoms symptoms Moderate primary Moderate primary Moderate primary Moderate primary possible problems possible problems occuring occuring occuring occuring with secondary with secondary with secondary with secondary eutrophic eutrophic eutrophic eutrophic conditions is conditions is conditions is conditions is but still very few but still very few symptoms indicating symptoms indicating symptoms indicating symptoms indicating substantial substantial substantial substantial secondary symptoms secondary symptoms serious problems serious problems serious problems serious problems expressed expressed 0.3 0.3 0.3 0.3 MODERATE HIGH MODERATE HIGH MODERATE HIGH MODERATE HIGH High secondary High secondary High secondary High secondary LOW LOW LOW LOW symptoms indicate symptoms indicate symptoms indicate symptoms indicate symptoms symptoms symptoms symptoms Low primary Low primary Low primary Low primary Level of expression of Level of expression of Level of expression of Level of expression of serious problems, but serious problems, but serious problems, but serious problems, but eutrophic eutrophic eutrophic eutrophic conditions is conditions is conditions is conditions is low primary indicates low primary indicates low primary indicates low primary indicates minimal minimal minimal minimal other factors may also other factors may also other factors may also other factors may also be involved in causing be involved in causing be involved in causing be involved in causing in causing the conditions in causing the conditions in causing the conditions in causing the conditions conditions conditions conditions conditions 0 0 0 0 0.3 0.3 0.3 0.3 0.6 0.6 0.6 0.6 1 1 1 1 Low secondary Low secondary Low secondary Low secondary Moderate secondary Moderate secondary Moderate secondary Moderate secondary High secondary High secondary High secondary High secondary symptoms symptoms symptoms symptoms symptoms symptoms symptoms symptoms symptoms symptoms symptoms symptoms
Future Outlook For Eutrophic Conditions Improve High No Change Worsen Low Low Susceptibility No Change Improve Low Worsen High Moderate No Change Worsen High Improve Low High Decrease No Change Increase Future Nutrient Pressures Determination of Future Outlook (DFO) - Response Future outlook is based on susceptibility and projected changes in nutrient pressures: Susceptibility is the capacity of a system to dilute or flush nutrients Nutrient pressure changes are based on expected population changes, future treatment and remediation plans and changes in watershed use (particularly agricultural)
ASSETS Synthesis of OHI - OEC - DFO Grades for OHI, OEC and DFO are combined into a grade of High, Good, Moderate, Poor and Bad with color coding to match the EU WFD convention. Combinations were distributed heuristically and impossible or improbable combinations were excluded.
Overall Human Influence (OHI) RegionOHIPrimary (No. systems) (M – H) >50% NPS NPS from Ag* No. Atlantic (18) 33 78 0 Mid Atlantic (22) 100 91 60 So. Atlantic (22) 81 100 81 Gulf of Mexico (38) 95 100 85 Pacific (39) 82 89 50 US Total (139) 68 92 56 as percentage of US systems US from SPARROW model estimates, *for US: >30% though most are >70% from ag http://ian.umces.edu/neeahttp://www.eutro.org
http://ian.umces.edu/neea ? Unknown (12) ? Moderate (28) High (12) Mod Low (23) Mod High (10) Low (5) (as percent of 139 US systems) Overall Eutrophic Conditions (OEC)
Unknown (0) ? No Change (32) Worsen (62) Improve (6) (as percent of 139 US systems) Determination of Future Outlook (DFO)
ASSETS Synthesis High 2 Good 19 Moderate 28 Poor 53 Bad 18 Unknown 19
Unknown (0) ? No Change (32) Worsen (62) Improve (6) (as percent of 139 US systems) Expected Change 1990s to 2020 http://ian.umces.edu/neea
Trend analysis Relate Pressure to State i.e. Modeling, type comparison Response No change Determine (a) Pressures (b) Modifications to improve State Make changes (i.e. implement measures) Interdiction, mitigation, enforcement Verify change in pressures Monitor state Evaluation of State based on eutrophic symptoms Assess drivers i.e. source apportionment, apply management measures Nutrients Sewage Agriculture IndustryAtmosphere Better Evaluation of required responseMonitoring, Research, Management No change High Worse Good Moderate Poor Bad Anthropogenic Natural
We Need You!! To: Beta test Survey website Enter data for Chesapeake systems Enter data for Maryland Coastal Bays Go to: http://ian.umces.edu/neea