Download
1 / 25
250 likes | 254 Views
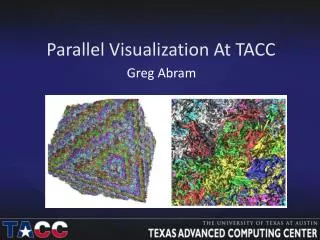
Visualization at KTH. Lennart Johnsson Professor CSC Director, PDC. Visualization at KTH. Courses Presentation facility Integrated into applications Visualization research Augmented reality – haptics Collaboration. Course setup.

E N D
Visualization at KTH Lennart Johnsson Professor CSC Director, PDC
Visualization at KTH • Courses • Presentation facility • Integrated into applications • Visualization research • Augmented reality – haptics • Collaboration
Course setup • 15 - 20 graphics workstations, half replaced every year with state-of-the-art graphics cards • Small graphics cluster, 4 – 8 nodes • Small display wall, 3x4 4 Mpixel LCD display • Software: • Support: 0.25 – 0.5 FTE
Course setup Hardware cost: ~1 Mkr (~0.5Mkr/yr) Software: 0.5 – 1 Mkr (~0.2Mkr/yr) Staff: 0.2 – 0.4 Mkr/yr Space: 0.15 Mkr/yr Total: ~1.2Mkr/yr
Presentation Facility 50 seat auditorium • Two 8 Mpixel projectors, stereo • Four graphics workstations each with • dual-core dual socket Opterons with 1GHz HT bus • 4+ GB of memory • Dual nVidia Quadro FX 4500 512MB cards • Audio
Presentation Facility 50 seat auditorium • Hardware cost: ~3Mkr • Software: 1 – 2 Mkr • Support: 0.25 – 0.5 FTE • Space: 0.4 Mkr/yr • Total: ~2.5Mkr/yr • Plus potentially shared rendering and simulation resources for large scale applications
Visualization integrated into applications Distributed Visualization • A small display facility for each application group • 2x3 or 3x4 display wall • 1 or 2 graphics workstations • Shared/central simulation, rendering and data management facility • Min 20 – 30 node cluster, hundreds of nodes or more for rendering of HD movies • Software: • High-Speed networking: 10 GigE
Visualization integrated into applications Distributed Visualization Local setup cost: 150 – 250kkr Shared setup: 750kkr – 30,000kkr Software: Infrastructure/space: 15%-20%/yr for shared setup Support: 0.1FTE/local setup 1+ FTE central 10 groups: 300+kkr/yr/group + Softw.
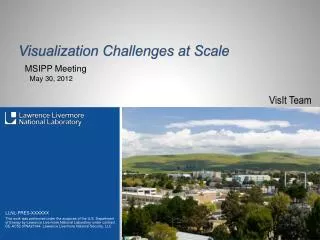
Visualization Research • Large scale ….. • 100+ Mpixels • Volume rendering of large data sets • Find data of interest/navigate/mine/ … • large data sets ………..
High-Resolution Visualization 2003 -2004
A Vision for the Future: Towards Gigapixel Displays SuperHD StreamingVideo Gigapixel Wall Paper Augmented Reality 1 GigaPixel x 3 Bytes/pixel x 8 bits/byte x 30 frames/sec ~ 1 Terabit/sec! Source: Jason Leigh, EVL, UIC
~10x10 square miles of 350 US Cities 2.5 Billion Pixel Images Per City! High Resolution Aerial Photography Generates Images With 10,000 Times More Data than Landsat7 Landsat7 Imagery 100 Foot Resolution Draped on elevation data USGS Shane DeGross, Telesis New USGS Aerial Imagery At 1-Foot Resolution Courtesy: Larry Smarr
OptIPortal– Termination Device for the OptIPuter Global Backplane Source: Phil Papadopoulos SDSC, Calit2
OptIPortal– Termination Device for the OptIPuter Global Backplane • 20 Dual CPU Nodes, 20 24” Monitors, ~$50,000 • 1/4 Teraflop, 5 Terabyte Storage, 45 Mega Pixels--Nice PC! • Scalable Adaptive Graphics Environment ( SAGE) Jason Leigh, EVL-UIC Source: Phil Papadopoulos SDSC, Calit2
Visualization Research • Facility needs • Display setup: 1 – 5 Mkr • Cluster setup: 1 – 5 Mkr • Network setup: 0.2 Mkr • Software: • Space: 0.5 Mkr • Support: 1 FTE • Total: 3 – 4Mkr/yr Projects: Virtual Fires GEMSViz Jaco3 Uni-Verse
A point of reference at KTH • 1996 – 2000: • PDC hardware investment – 14.7 Mkr • 1998 – 2001: • Staff, software, maintenance etc, 4 Mkr • Lokaler • ~0.6 Mkr/yr Total: ~4.5 Mkr/yr
Augmented reality – Haptic Lab Boeing UNC – Henry Fuchs Harvard Medical School
Collaboration - Communication Argonne • Access Grid and more University of Salford 3D Telepresence and Medical Consultation University of Quensland
ETF Management Meeting Seminar Typical Views of Access Grid Seminar SC Global Workshop Performance Art
“The future is already here, it’s just not evenly distributed”William Gibson, Author of Neuromancer • Mobile Broadband • 0.05 to 0.5 Mbps • Home Broadband • 1-5 Mbps • Calit2 Global Broadband • 1,000-10,000 Mbps
Use of OptIPortal to Interactively View Microbial Genome 15,000 x 15,000 Pixels Acidobacteria bacterium Ellin345 (NCBI)Soil Bacterium 5.6 Mb Source: Raj Singh, UCSD
Use of OptIPortal to Interactively View Microbial Genome 15,000 x 15,000 Pixels Acidobacteria bacterium Ellin345 (NCBI)Soil Bacterium 5.6 Mb Source: Raj Singh, UCSD
Use of OptIPortal to Interactively View Microbial Genome 15,000 x 15,000 Pixels Acidobacteria bacterium Ellin345 (NCBI)Soil Bacterium 5.6 Mb Source: Raj Singh, UCSD