Download
1 / 75
750 likes | 797 Views
Mass Spectrometry: Methods & Theory. MS Principles. Different elements can be uniquely identified by their mass. N. -CH 2 -. OH. COOH. HO. -CH 2 CH-NH 2. HO. HO. MS Principles. Different compounds can be uniquely identified by their mass. Butorphanol L-dopa Ethanol.

E N D
MS Principles • Different elements can be uniquely identified by their mass
N -CH2- OH COOH HO -CH2CH-NH2 HO HO MS Principles • Different compounds can be uniquely identified by their mass Butorphanol L-dopa Ethanol CH3CH2OH MW = 327.1 MW = 197.2 MW = 46.1
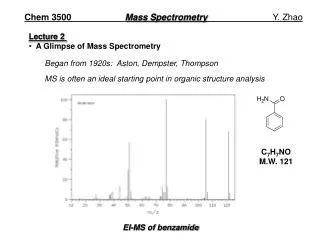
Mass Spectrometry • Analytical method to measure the molecular or atomic weight of samples
Mass Spectrometry • For small organic molecules the MW can be determined to within 5 ppm or 0.0005% which is sufficiently accurate to confirm the molecular formula from mass alone • For large biomolecules the MW can be determined within an accuracy of 0.01% (i.e. within 5 Da for a 50 kD protein) • Recall 1 dalton = 1 atomic mass unit (1 amu)
Masses in MS • Monoisotopic mass is the mass determined using the masses of the most abundant isotopes • Average mass is the abundance weighted mass of all isotopic components
Isotopic Distributions 1H = 99.9% 12C = 98.9% 35Cl = 68.1% 2H = 0.02% 13C = 1.1% 37Cl = 31.9%
Isotopic Distributions 1H = 99.9% 12C = 98.9% 35Cl = 68.1% 2H = 0.02% 13C = 1.1% 37Cl = 31.9% 100 32.1 6.6 2.1 0.06 0.00 m/z
Mass Calculation (Glycine) NH2—CH2—COOH Amino acid R1—NH—CH2—CO—R3 Residue Glycine Amino Acid Mass 5xH + 2xC + 2xO + 1xN = 75.032015 amu Glycine Residue Mass 3xH + 2xC + 1xO + 1xN =57.021455 amu Monoisotopic Mass 1H = 1.007825 12C = 12.00000 14N = 14.00307 16O = 15.99491
Amino Acid Residue Masses Monoisotopic Mass Glycine 57.02147 Alanine 71.03712 Serine 87.03203 Proline 97.05277 Valine 99.06842 Threonine 101.04768 Cysteine 103.00919 Isoleucine 113.08407 Leucine 113.08407 Asparagine 114.04293 Aspartic acid 115.02695 Glutamine 128.05858 Lysine 128.09497 Glutamic acid 129.0426 Methionine 131.04049 Histidine 137.05891 Phenylalanine 147.06842 Arginine 156.10112 Tyrosine 163.06333 Tryptophan 186.07932
MS History • JJ Thomson built MS prototype to measure m/z of electron, awarded Nobel Prize in 1906 • MS concept first put into practice by Francis Aston, a physicist working in Cambridge England in 1919 • Designed to measure mass of elements (iso.) • Aston Awarded Nobel Prize in 1922 • 1920s - Electron impact ionization and magnetic sector mass analyzer introduced
MS History • 1948-52 - Time of Flight (TOF) mass analyzers introduced • 1955 - Quadrupole ion filters introduced by W. Paul, also invents the ion trap in 1983 (wins 1989 Nobel Prize) • 1968 - Tandem mass spectrometer appears • Mass spectrometers are now one of the MOST POWERFUL ANALYTIC TOOLS IN CHEMISTRY
MS Principles • Find a way to “charge” an atom or molecule (ionization) • Place charged atom or molecule in a magnetic field or subject it to an electric field and measure its speed or radius of curvature relative to its mass-to-charge ratio (mass analyzer) • Detect ions using microchannel plate or photomultiplier tube
Mass Spec Principles Sample + _ Detector Ionizer Mass Analyzer
Typical Mass Spectrum aspirin
Typical Mass Spectrum • Characterized by sharp, narrow peaks • X-axis position indicates the m/z ratio of a given ion (for singly charged ions this corresponds to the mass of the ion) • Height of peak indicates the relative abundance of a given ion (not reliable for quantitation) • Peak intensity indicates the ion’s ability to desorb or “fly” (some fly better than others)
DM M Resolution & Resolving Power • Width of peak indicates the resolution of the MS instrument • The better the resolution or resolving power, the better the instrument and the better the mass accuracy • Resolving power is defined as: • M is the mass number of the observed mass (DM) is the difference between two masses that can be separated
Resolution in MS 783.455 QTOF 784.465 785.475 783.6
Turbo pumps Diffusion pumps Rough pumps Rotary pumps High Vacuum System Ion Source Mass Filter Inlet Data System Detector Sample Plate Target HPLC GC Solids probe TOF Quadrupole Ion Trap Mag. Sector FTMS Microch plate Electron Mult. Hybrid Detec. PC’s UNIX Mac MALDI ESI IonSpray FAB LSIMS EI/CI Mass Spectrometer Schematic
Different Ionization Methods • Electron Impact (EI - Hard method) • small molecules, 1-1000 Daltons, structure • Fast Atom Bombardment (FAB – Semi-hard) • peptides, sugars, up to 6000 Daltons • Electrospray Ionization (ESI - Soft) • peptides, proteins, up to 200,000 Daltons • Matrix Assisted Laser Desorption (MALDI-Soft) • peptides, proteins, DNA, up to 500 kD
Electron Impact Ionization • Sample introduced into instrument by heating it until it evaporates • Gas phase sample is bombarded with electrons coming from rhenium or tungsten filament (energy = 70 eV) • Molecule is “shattered” into fragments (70 eV >> 5 eV bonds) • Fragments sent to mass analyzer
EI Fragmentation of CH3OH CH3OH CH3OH+ CH3OH CH2O=H+ + H CH3OH + CH3 + OH CH2O=H+ CHO=H+ + H
Why You Can’t Use EI For Analyzing Proteins • EI shatters chemical bonds • Any given protein contains 20 different amino acids • EI would shatter the protein into not only into amino acids but also amino acid sub-fragments and even peptides of 2,3,4… amino acids • Result is 10,000’s of different signals from a single protein -- too complex to analyze
Soft Ionization • Soft ionization techniques keep the molecule of interest fully intact • Electro-spray ionization first conceived in 1960’s by Malcolm Dole but put into practice in 1980’s by John Fenn (Yale) • MALDI first introduced in 1985 by Franz Hillenkamp and Michael Karas (Frankfurt) • Made it possible to analyze large molecules via inexpensive mass analyzers such as quadrupole, ion trap and TOF
Soft Ionization Methods 337 nm UV laser Fluid (no salt) + _ Gold tip needle cyano-hydroxy cinnamic acid MALDI ESI
Electrospray Ionization • Sample dissolved in polar, volatile buffer (no salts) and pumped through a stainless steel capillary (70 - 150 mm) at a rate of 10-100 mL/min • Strong voltage (3-4 kV) applied at tip along with flow of nebulizing gas causes the sample to “nebulize” or aerosolize • Aerosol is directed through regions of higher vacuum until droplets evaporate to near atomic size (still carrying charges)
Electrospray Ionization 5%H2O/95%CH3CN 95%H2O/5%CH3CN 100 V 1000 V 3000 V
Electrospray Ionization • Can be modified to “nanospray” system with flow < 1 mL/min • Very sensitive technique, requires less than a picomole of material • Strongly affected by salts & detergents • Positive ion mode measures (M + H)+ (add formic acid to solvent) • Negative ion mode measures (M - H)- (add ammonia to solvent)
Positive or Negative Ion Mode? • If the sample has functional groups that readily accept H+ (such as amide and amino groups found in peptides and proteins) then positive ion detection is used • If a sample has functional groups that readily lose a proton (such as carboxylic acids and hydroxyls as found in nucleic acids and sugars) then negative ion detection is used
Electrospray Ionization • Samples of MW up to 1200 Da usually produce singly charged ions with observed MW equal to parent mass + H (1.008 Daltons) • Larger samples (typically peptides) yield ions with multiple charges (from 2 to 20 +) • Multiply charged species form a Gaussian distribution with those having the most charges showing up at lower m/z values
Multiply Charged Ions ESI spectrum of HEW Lysozyme MW = 14,305.14
m/z = (MW + nH+) n Peptide Masses From ESI Each peak is given by: m/z = mass-to-charge ratio of each peak on spectrum MW = MW of parent molecule n = number of charges (integer) H+ = mass of hydrogen ion (1.008 Da)
Peptide Masses From ESI Charge (n) is unknown, Key is to determine MW Choose any two peaks separated by 1 charge 1301.4 = (MW + [n+1]H+) 1431.6 = (MW + nH+) [n+1] n 2 equations with 2 unknowns - solve for n first n = 1300.4/130.2 = 10 Substitute 10 into first equation - solve for MW MW = 14316 - (10x1.008) = 14305.9 14,305.14
ESI Transformation • Software can be used to convert these multiplet spectra into single (zero charge) profiles which gives MW directly • This makes MS interpretation much easier and it greatly increases signal to noise • Two methods are available • Transformation (requires prior peak ID) • Maximum Entropy (no peak ID required)
ESI and Protein Structure • ESI spectra are actually quite sensitive to the conformation of the protein • Folded, ligated or complexed proteins tend to display non-gaussian peak distributions, with few observable peaks weighted toward higher m/z values • Denatured or open form proteins/peptides which ionize easier tend to display many peaks with a classic gaussian distribution
ESI and Protein Conformation Native Azurin Denatured Azurin
Matrix-Assisted Laser Desorption Ionization 337 nm UV laser cyano-hydroxy cinnamic acid MALDI
MALDI • Sample is ionized by bombarding sample with laser light • Sample is mixed with a UV absorbant matrix (sinapinic acid for proteins, 4-hydroxycinnaminic acid for peptides) • Light wavelength matches that of absorbance maximum of matrix so that the matrix transfers some of its energy to the analyte (leads to ion sputtering)
MALDI Ionization Matrix + + + - • Absorption of UV radiation by chromophoric matrix and ionization of matrix • Dissociation of matrix, phase change to super-compressed gas, charge transfer to analyte molecule • Expansion of matrix at supersonic velocity, analyte trapped in expanding matrix plume (explosion/”popping”) - Laser - + Analyte + + + - + + - - + - + + + + + +
MALDI • Unlike ESI, MALDI generates spectra that have just a singly charged ion • Positive mode generates ions of M + H • Negative mode generates ions of M - H • Generally more robust that ESI (tolerates salts and nonvolatile components) • Easier to use and maintain, capable of higher throughput • Requires 10 mL of 1 pmol/mL sample
MALDI Sample Limits • Phosphate buffer < 50 mM • Ammonium bicarbonate < 30 mM • Tris buffer < 100 mM • Guanidine (chloride, sulfate) < 1 M • Triton < 0.1% • SDS < 0.01% • Alkali metal salts < 1 M • Glycerol < 1%
MALDI = SELDI 337 nm UV laser cyano-hydroxy cinnaminic acid MALDI