Download

1 / 25
250 likes | 393 Views
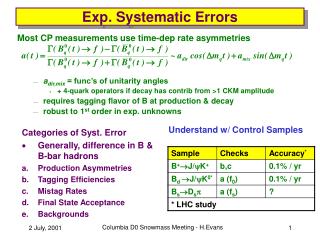
Systematic errors in medium-range forecasts of tropopause structure. Suzanne Gray , Caroline Dunning, John Methven, Giacomo Masato, Jeffrey Chagnon. University of Reading. September 2013. Potential vorticity. tropopause.

E N D
Systematic errors in medium-range forecasts of tropopause structure Suzanne Gray, Caroline Dunning, John Methven, Giacomo Masato, Jeffrey Chagnon. University of Reading September 2013
Potential vorticity tropopause Potential vorticity is conserved following fluid parcels for adiabatic frictionless flow. This makes it a good tracer for upper-tropospheric air over several days. 330K 270K Climatology of PV (in PVU) and qin NH winter (Hoskins, 1990)
Potential vorticity Rossby Waves (or planetary waves): PV conserving motion that owes its existence to the isentropic gradient of PV. ECMWF analyses of PV on 315K isentrope.
Forecast errors in upper-level PV PV on 320 K isentrope (analysis and 96h forecast): 1200 UTC 16 Jan 2002 (Davies and Didone 2013) Rossby wave amplitude at the extratropicaltropopause inadequately developed in ECMWF operational forecasts: DJF 2001-2 so 10 years ago (Dirren et al. 2003).
Mechanisms of Rossby-wave growth Initial time Later time (Davies and Didone 2013)
Mechanisms of Rossby-wave growth Band of anomalously low PV on the equatorward side of the tropopause Deflects tropopauseequatorward (Davies and Didone 2013)
Mechanisms of Rossby-wave growth longitude Schematic illustration of the diabatic PV dipole relative to the tropopause in Rossbywave – based on extratropical cyclone case study (Chagnon et al. 2012)
Extratropical cyclone influence on Rossby wave growth Intersecting WCB2 air parcels on 305K surface Intersecting WCB1 air parcels on 315K surface Martínez-Alvarado et al (submitted)
Forecast errors in upper-level PV analysis Control run Reduced LH Long lead time forecast TIGGE forecasts for Nov 2009 case study (MSc thesis, Sideri 2013 supervised by Chagnon and Martínez-Alvarado)
AIM Quantification of the systematic error in tropopause structure in medium-range weather forecasts.
Data • Data extracted from the TIGGE (THORPEX Interactive Grand Global Ensemble) archive*. • Daily (12 UTC) northern hemisphere fields of PV on the 320K isentrope used from the control runs • Three operational centres: ECMWF, the Met Office, and NCEP • Six winter seasons (December, January and February from 2006/7 (2008/9 for NCEP) to 2011/12). *The TIGGE archive consists of global model ensemble forecast data from ten NWP centres, starting from October 2006: see http://tigge.ecmwf.int/
Example forecast errors Two types: • Amplitude error • Location error PV on 320K isentrope
Categorisation Define using • PV value (greater or less that the assumed tropopause value: 2.24PVU assumed here). • Equivalent latitude (north or south) where the equivalent latitude is the limiting latitude if the area, A, in which the PV on an isentope < tropopause PV is reshaped into a pole-centred circle.
Hemispheric errors Average RMS forecast – analysis difference.
Hemispheric errors Average RMS forecast – analysis difference scaled by mean analysis PV for forecast centre.
Ridge area forecast 2.55x10⁷ km2 2006/7 2007/8 2008/9 2009/10 2010/11 2011/12 Reduced forecast resolution after day 10
Conclusions • Upper-level PV forecast errors in operational global models saturate after about 9 days. • Met Office and ECMWF forecasts show a decrease in ridge area with forecast leadtime and increase in mean ridge PV out to 5 days. • NCEP results vary strongly with year but also show an increase in mean ridge PV with forecast lead time. • The forecast biases in PV in analysed ridges are consistent with a reduction in • the Rossby wave amplitude and • PV gradient across the tropopause • Mechanism causing error growth is not proven here but …… …errors are consistent with a systematic failure of forecasts in the representation of the outflow of air with a negative anomalies of PV from diabatic processes in warm conveyor belts into ridges.
Example forecast errors PV on 320K isentrope
Ridge area forecast: tropopause PV = 3.35 PVU
Ridge PV forecast tropopause PV = 3.35 PVU
Sources and sinks where H is the heating rate Instantaneous heating Steady heating PV dipole arising from heating applied in a barotropic environment
PV effect on cyclones: direct effect Tropopause erosion and/or upper-level divergence. Associated with ‘type C’ cyclogenesis(Plant et al., 2003).
PV effect on cyclones: indirect effect Jet enhancement leading to modified Rossby wave propagation